PP vs. Lap Time//Graph Comparison (51 Cars, Untuned)//*UPDATE 4/2/13*

  • Thread starter GNR1987
  • 45 comments
  • 24,624 views
Great thread! Would be cool to see the chart with the trend line along the x axis with bars representing the car's distance from the trend line. Might try that out if I have some time.

Feel like testing a Shelby Series 1? :)
 
Ran laps and posted times for:
Toyota Tacoma X-Runner '04
Vauxhall VX220 Turbo '00
Buick GNX '87
Ford Focus RS '02

You know where to find them.


Edit:
Feel like testing a Shelby Series 1? :)
Were you talking to me, or GNR? If me, I did a Shelby Series One Supercharged, is there another version? If GNR, I have a spare I just nabbed at the UCD if he wants it to run a test with.
 
Last edited:
Great thread! Would be cool to see the chart with the trend line along the x axis with bars representing the car's distance from the trend line. Might try that out if I have some time.

Something like one of these? First is %, second is time (in seconds). They both work out to similar values because the average lap time was ~1.40.000, which equals 100 seconds. So 1% just convenientaly happens to roughly = 1.00sec. It will be different on FFIX's Grand Valley East chart.

TrialMtn-1.png


TrialMtns.png
 
Last edited:
Ran laps and posted times for:
Acura CL 3.2 Type-S '01
Subaru LEGACY B4 RSK '98
Toyota SOARER 43SCV '01
Mazda MX-Crossport Concept '05

Find them with the rest.


In testing these cars I had a thought, which I mentioned in the Crossport notes but I'll put here as well: Does Mazda actually put amazing brakes on their concept cars, or is beefing up Concept brakes just one more way PD fudges car specs to make them feel different?

And I had another idea, maybe we should be looking at these graphs with emphasis on drivetrains; I know the JGTC gives MRs a weight penalty, maybe PD gives them a PP one. Just a thought.

With this round of tests does anyone see any other obvious gaps I should work on filling in, or should I ho back to just going through my Standard garage and picking cars out at random?
 
Last edited:
In testing these cars I had a thought, which I mentioned in the Crossport notes but I'll put here as well: Does Mazda actually put amazing brakes on their concept cars, or is beefing up Concept brakes just one more way PD fudges car specs to make them feel different?

I'd imagine concept cars have the best stuff a company has to offer; as to look good at car shows where they debut, such as SEMA. It probably does have larger brakes than it's production counter-part. However, I couldn't find tire or brake data for this car.

Brake size: production vs concept Mazda's:

2006 Mazda MX-5 Miata & 2006 Mazdaspeed MX-5 Miata
  • f: 290mm/11.4in
  • r: 279mm/10.9in
2001 Mazda MX-5 MPS Concept
  • f: 314mm/12.4in
  • r: 314mm/12.4in

It's not much, but it's hard to find data on concept cars. I tried my hand at RX8's and such, but couldn't come away with enough data for a comparison.

And I had another idea, maybe we should be looking at these graphs with emphasis on drivetrains; I know the JGTC gives MRs a weight penalty, maybe PD gives them a PP one. Just a thought.

It's a possibility. But I don't think the street MR's receive a PP penalty from PD. There seems to be a mix of performance among the MR's.

The lightweight MR's such as the Elise, Europa and ZZ-S are running times above the trendline. Whereas the Berlinette and VX220 are both below.

Same goes for the heavier MR's. NSX's are below while the SPIRRA is above.

But of course, more MR's would be needed to draw a conclusion or see a trend. I'm assuming PD wouldn't knock the street NSX, seeing how it's Japan's flagship car. So it may be an exception to a PP nerfing, if there is one for street cars. But you are right about the JGTC rules. Maybe test a MR similar in weight to the NSX, such as a Lotus Esprit?

With this round of tests does anyone see any other obvious gaps I should work on filling in, or should I ho back to just going through my Standard garage and picking cars out at random?

Heavier MR's like the Esprit maybe? And the 450-470PP range could use some more cars, judging by the graph, just so you know.
 
Ran laps with and posted times for:
Mazda RX-7 Type R (FD, J) '91
Lotus Evora '09
Lotus Esprit Turbo HC '87
Lotus Esprit V8 '02

You know where to find them.


I started with the RX-7 before I read the suggestion to try some more heavy MRs, and then ran all my Lotuses; I'll probably go back to my bunch of RX-7s next update just to get them out of the way.

That post sure is getting to be a monster, I'm not sure my phone enjoys editing it very much anymore.
 
Ran laps with and posted times for:
Lancia STRATOS '73
Mazda RX-7 Type RZ (FD, J) '92
Mazda éfini RX-7 Type RZ (FD) '93
Mazda RX-7 Type RZ (FD) '00

With the Stratos I am out of "heavy" MRs to test, so I went back to my "not another RX-7..." run. Sometimes I swear a third of the cars in this game are Skylines, NSXes, Miatas or RX-7s.
 
Ran laps with and posted times for:
Nissan Fairlady Z Version ST (Z33) '02
Mercury Cougar XR-7 '67
Chrysler 300C '05
Chevrolet Corvette GRAND SPORT (C4) '96

You know where to find them.


That brings my total up to 44 cars and about 520 laps and I've gotta say I'm getting sick of Grand Valley East. Unless you guys think I need to run more cars I think I'd like to call my tests done.

Great job FFIX! The spreadsheet is complete. I will send you the photobucket links in a PM. However, I will attach the PDF here. 520 laps is a lot of work! Thank you for taking the time and putting forth the effort to help me with this project. :)
 

Attachments

  • GrandValleyEast2.0.pdf
    101.5 KB · Views: 34
Great job FFIX! The spreadsheet is complete. I will send you the photobucket links in a PM. However, I will attach the PDF here. 520 laps is a lot of work! Thank you for taking the time and putting forth the effort to help me with this project. :)
And thank you for having such an interesting project worth putting so much time and effort into; I really did have fun doing all that test driving. Well, most of the time, anyway.

I did try attaching the PDF to my own post, but it seems like vB file upload doesn't play well with Android and it wouldn't let me, so I just linked back to your post.


I really hope some more people take an interest in this and run their own tests at different courses, because I'm not sure I could take 500+ laps on another course.
 
*4/2/13 Update* - Scroll ~3/4 way down to see the added Grand Valley East Data.
-----------------------------------------------------------------------------------------------------
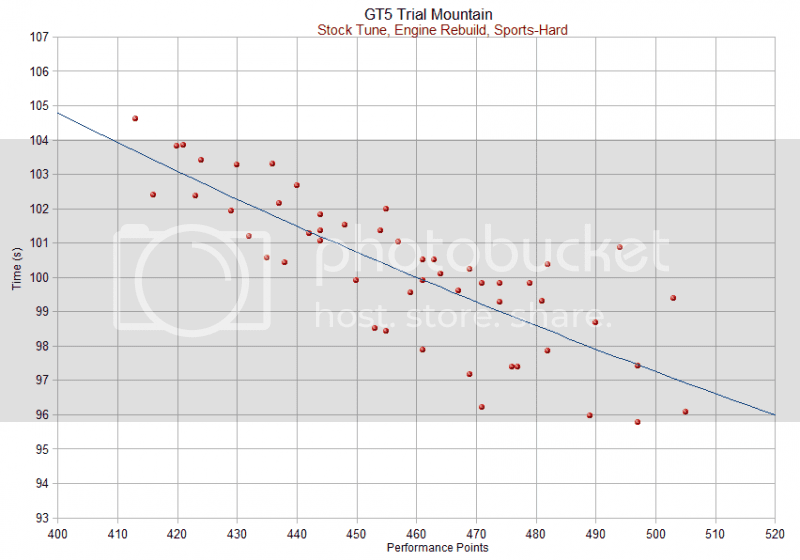
This is my PP vs. Lap Time comparison on Trial Mountain.

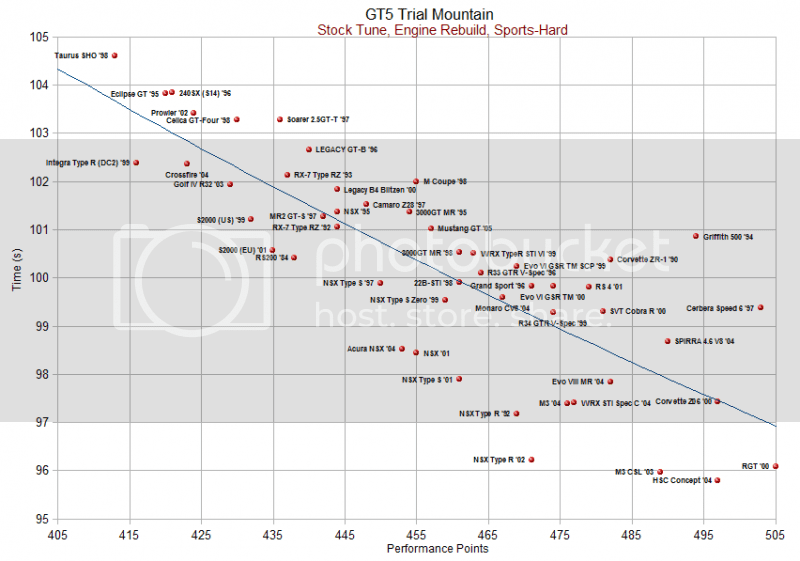
  • The idea is to run a variety of stock un-tuned cars, on the same tire, and plot the data in an attempt to extract a relative trend-line. This line will hopefully give the expected lap time for a specific PP.
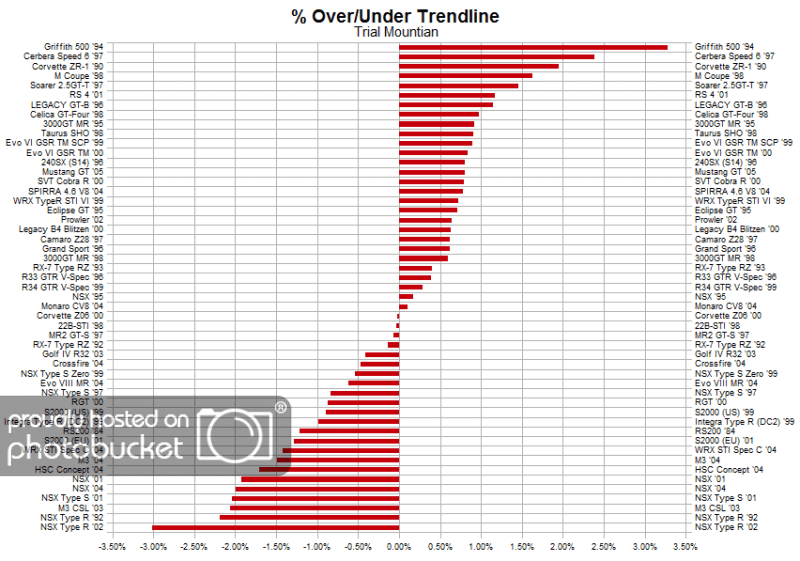
  • Cars under the line are "efficient" and cars above the line are "expensive" as bys put it in his thread, "Are all Performance Points created equal?" I had started doing these runs before I had known about bys' thread. But he obviously did it first, and credit for jump-starting me into going through with posting this, rather than keeping to myself, goes to him.

I have attached a more detailed/cleaner PDF file. It contains more of an introduction/explanation. The graphs came out better in the attached file as well.

OPEN TO SUGGESTIONS AND/OR OTHER TESTABLE/CALCULABLE VARIABLES

Course: Trial Mountain
Assists: No Aids / ABS : 1 / Grip Reduction : Real / DS3: Sensitivity 7
Tunes: Stock Settings / Engine Overhaul / Sport Hard tires

Trial Mountain is one of my favorite tracks, and I consider my times to be decent. I ran anywhere from 5-20 laps per car. I'd guess 8-11 on average.
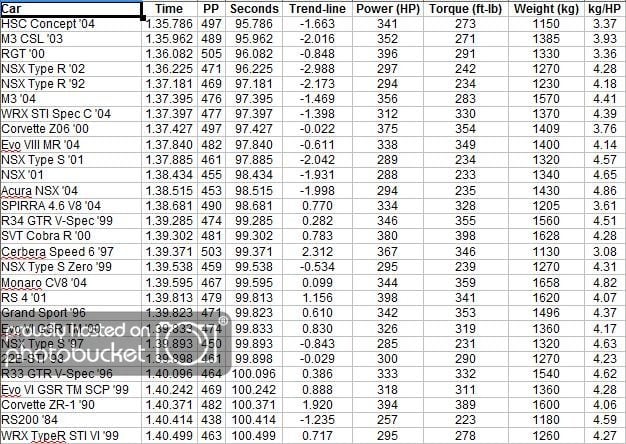
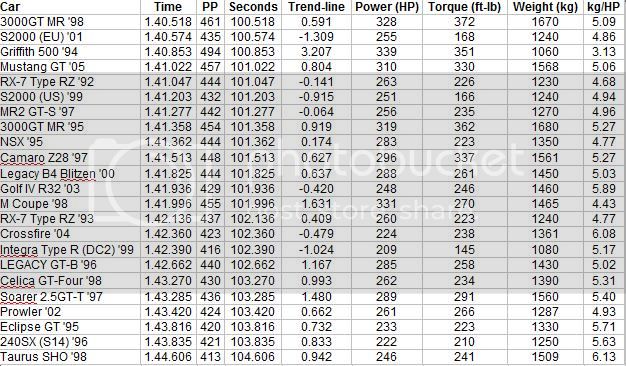
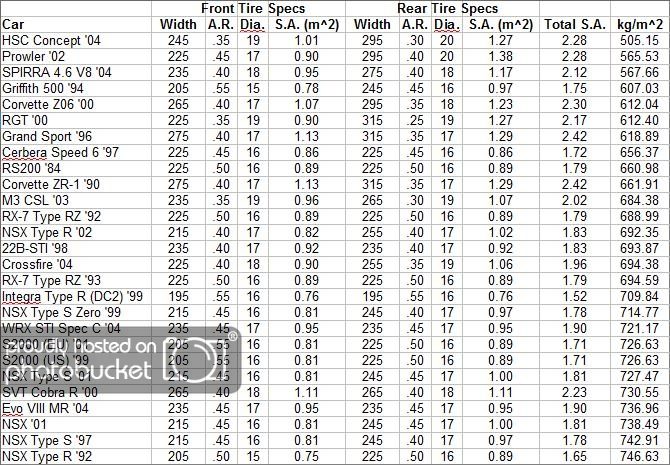
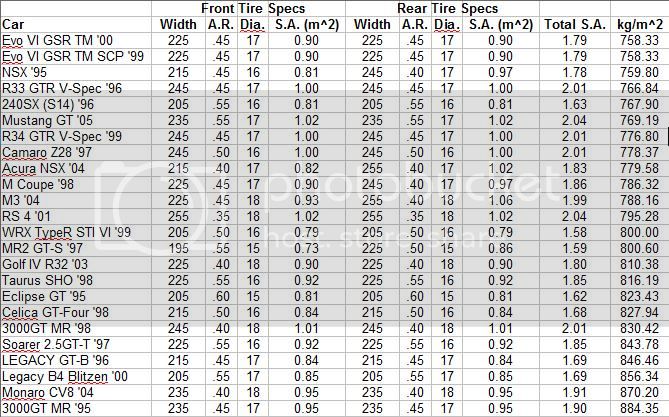
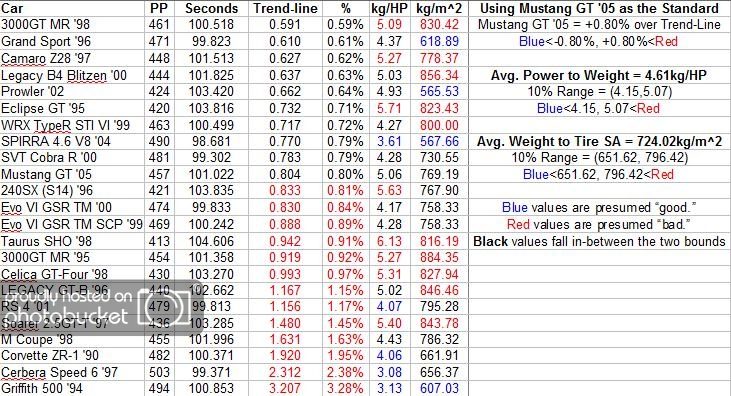
Car Data
PPvsTime1.jpg

PPvsTime2.jpg


Graph with data labels
TrialMountainGraph.png


Graph without labels and a larger scale for better trend-line visual
TrialMountainNoLabel.png


Tire Data arranged by Weight/Tire Surface Area (kg/m^2)
TireDataUpdated-1.jpg

TireDataUpdated2-1.jpg


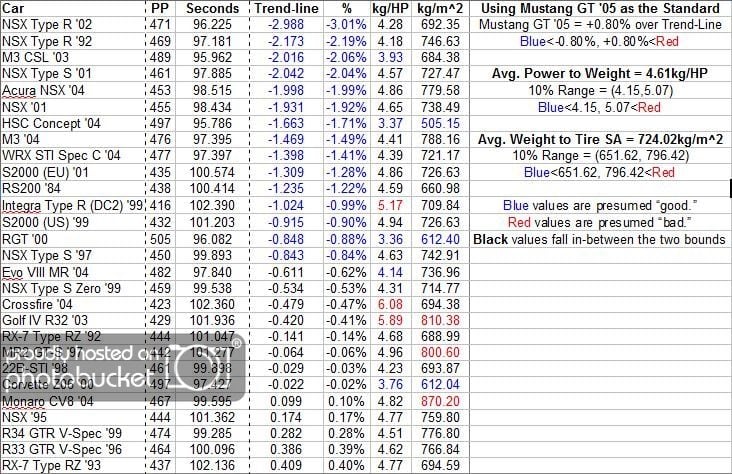
All Calculated Findings arranged by % under/over trendline
Findings1-1.jpg

Findings2-1.jpg


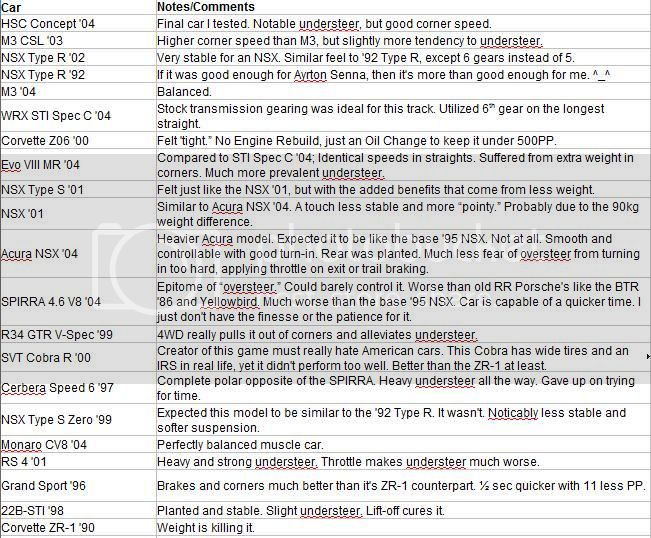
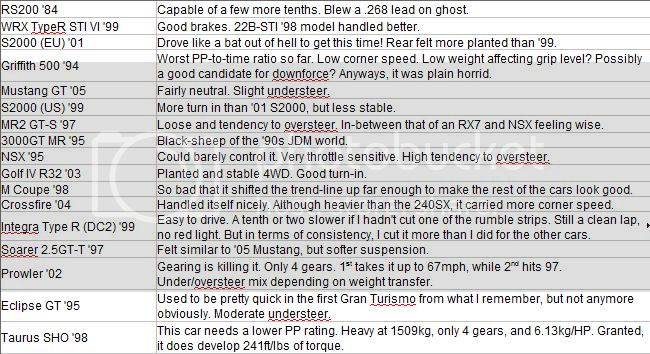
Subjective interpretations/analysis of certain cars
Comments1.jpg

Comments2.jpg


Enjoy the data! This took a lot of time do to! ~10 laps x 51 cars > 500 laps.

Hopefully some of you can draw some correlations between the data or offer suggestions.

I also plotted a Nurburgring Graph using ~10 untuned 90's JDM sport cars. But I'll save that for another time. mike_gt3's Nordschleife Thread/Database of untuned cars would make a much better candidate for making another trend-line graph.

Tire Data Sources
Gran Turismo 1 In-Game Car Specs
http://www.nsxprime.com/wiki/Wheel-Tech-OEM
http://www.v8sho.com/SHO/genspecs.html
http://www.supercars.net/index.html
http://www.motortrend.com/roadtests/exotic/112_0804_2008_spirra_s_first_look/
http://www.performancesimulations.com/fact-or-fiction-tires-1.htm
http://www.rsportscars.com/honda/200...a-hsc-concept/
http://www.automobile-catalog.com/
http://www.tirerack.com

Attached PDF below.
Very nice work, clearly shows there is good relationship between PP and lap times with some specific variations.
 
Ran laps with and posted times for:
Nissan Fairlady Z Version ST (Z33) '02
Mercury Cougar XR-7 '67
Chrysler 300C '05
Chevrolet Corvette GRAND SPORT (C4) '96


You know where to find them.


That brings my total up to 44 cars and about 520 laps and I've gotta say I'm getting sick of Grand Valley East. Unless you guys think I need to run more cars I think I'd like to call my tests done.
Unless you want to do Jay Leno tank car and a Kart? As opposite ends of the ranges?
 
Unless you want to do Jay Leno tank car and a Kart? As opposite ends of the ranges?
Gosh, it's been nearly a year since I ran these tests. I guess I could do a few more laps with a couple karts and the tank car.

The tank is at 537PP, though, after the engine overhaul, so it's a bit higher than any of the other cars I tested.

EDIT:
Okay, I've run some laps with the Tank Car and with the Kart 125; I'm not gonna bother editing them into my other post with all the rest of the cars because they are pretty heavy outliers.

Jay Leno Tank Car '03 — 932hp / 1658ft-lb / 3500kg / 537pp
Laps run: 15 / Best on: 12 / Time: 1'20.736"
Notes: Got it up to 6th gear and about 138mph in the straight without hitting the rev limiter, but for the entire track I was afraid to really put my foot down because it was pretty tail-happy and when I gave it too much it would slide out from under me. Not super happy with my time; I feel like the car could maybe shave another half a second off with a really good lap but I just can't make it behave.

Gran Turismo Racing Kart 125 — 28hp / 14ft-lb / 90kg / 499pp
Laps run: 7 / Best on: 5 / Time: 1'21.119"
Notes: This poor thing capped out at 86mph and ran nearly the entire course at full throttle; I ran so few laps because I was really chasing hundredths of a second by that point. It just doesn't have much more to give in a course with such easy turns.
 
Last edited:

Latest Posts

Back