PP vs. Lap Time//Graph Comparison (51 Cars, Untuned)//*UPDATE 4/2/13*

  • Thread starter GNR1987
  • 45 comments
  • 24,680 views
105
United States
United States
GNR1987
*4/2/13 Update* - Scroll ~3/4 way down to see the added Grand Valley East Data.
-----------------------------------------------------------------------------------------------------
This is my PP vs. Lap Time comparison on Trial Mountain.

  • The idea is to run a variety of stock un-tuned cars, on the same tire, and plot the data in an attempt to extract a relative trend-line. This line will hopefully give the expected lap time for a specific PP.
  • Cars under the line are "efficient" and cars above the line are "expensive" as bys put it in his thread, "Are all Performance Points created equal?" I had started doing these runs before I had known about bys' thread. But he obviously did it first, and credit for jump-starting me into going through with posting this, rather than keeping to myself, goes to him.
OPEN TO SUGGESTIONS AND/OR OTHER TESTABLE/CALCULABLE VARIABLES

Course: Trial Mountain
Assists: No Aids / ABS : 1 / Grip Reduction : Real / DS3: Sensitivity 7
Tunes: Stock Settings / Engine Overhaul / Sport Hard tires

Trial Mountain is one of my favorite tracks, and I consider my times to be decent. I ran anywhere from 5-20 laps per car. I'd guess 8-11 on average.

Car Data
PPvsTime1.jpg

PPvsTime2.jpg


Graph with data labels
TrialMountainGraph.png


Graph without labels and a larger scale for better trend-line visual
TrialMountainNoLabel.png


Tire Data arranged by Weight/Tire Surface Area (kg/m^2)
TireDataUpdated-1.jpg

TireDataUpdated2-1.jpg


All Calculated Findings arranged by % under/over trendline
Findings1-1.jpg

Findings2-1.jpg


Subjective interpretations/analysis of certain cars
Comments1.jpg

Comments2.jpg


Enjoy the data! This took a lot of time do to! ~10 laps x 51 cars > 500 laps.

Hopefully some of you can draw some correlations between the data or offer suggestions.

I also plotted a Nurburgring Graph using ~10 untuned 90's JDM sport cars. But I'll save that for another time. mike_gt3's Nordschleife Thread/Database of untuned cars would make a much better candidate for making another trend-line graph.

Tire Data Sources
Gran Turismo 1 In-Game Car Specs
http://www.nsxprime.com/wiki/Wheel-Tech-OEM
http://www.v8sho.com/SHO/genspecs.html
http://www.supercars.net/index.html
http://www.motortrend.com/roadtests/exotic/112_0804_2008_spirra_s_first_look/
http://www.performancesimulations.com/fact-or-fiction-tires-1.htm
http://www.rsportscars.com/honda/200...a-hsc-concept/
http://www.automobile-catalog.com/
http://www.tirerack.com
 
Last edited:
Nice work.

Are you listening PD? If you just took something like this and adjusted PP +/- instead of that debacle that was 2.10, we'd be golden. [ie '02 NSX Type R grew to 485 PP Stock and the Griffith dropped to 478 PP]
 
Excellent work, I'll have to look at this later. Tests across different tracks are probably required to draw proper conclusions though.
 
Excellent work, I'll have to look at this later. Tests across different tracks are probably required to draw proper conclusions though.

I agree. But as a one man job, ~500laps over 2-3 days just about drove me crazy.

mike-gt3's Nordschleife Lap Times thread https://www.gtplanet.net/forum/showthread.php?t=265884 would make a good candidate. Especially because the lap times are open to the public. Thus they are constantly updated with the best time each car can obtain.

Thanks for taking the time to read over my thread. I believe you had posted some aero CAD data in another thread, if I'm not mistaken? Much more technical than the simple work I am doing. So your input would be greatly appreciated.
 
Last edited:
Excellent work, I'll have to look at this later. Tests across different tracks are probably required to draw proper conclusions though.

True, in an ideal world, PP would be calculated on a track-by-track basis... :D ...but mad props for actually doing this work. Perhaps to go forward would require a collaborative effort among a number of drivers, in order to build a better picture of the situation.

Too bad we no longer have online leaderboards for stock cars, like we did in GT5P. That would be an excellent shortcut for graphing PP levels against laptimes.

Also, seems like the cars at the further end of the scale scatter more. Obviously the more powerful cars are difficult to drive on Sports Hards, so the graph might not hold true once you move up to R-tires, where excessive wheelspin or the need for throttle modulation on cars like the ZR1 is not as big a problem.

Still, from one former testing fanatic to another, I salute you. ;)
 
All I can say is really well done - I can't imagine the possibilities that doing this and posting has created for these forums. I can say though, that these times are really good. The best I could ever do in the NSX '02 completely stock was 1'39. So I can see that more time can be made :scared:
 
I agree. But as a one man job, ~500laps over 2-3 days just about drove me crazy.

I can imagine. I tried doing something like this for prize car probability, but I couldn't find help; getting the numbers for all the tickets on my own wasn't an option so I had to stop.

Perhaps I could jump back to GT5 for a little bit to generate some data, though I'm probably going to be a little slow and inconsistent as I haven't played for a while and the physics have changed while I've been gone.

Using the Ring laptime thread would be a good idea, and with two tracks, we might be able to see if there are trends related to other stats like hp, or power/weight. I'd personally like to see if some tracks favor more power for a given PP than others, as well as the impact of downforce (though that goes a little beyond stock road cars).

If this work is to be expanded, it might help to try the shorter tracks first. Tsukuba is a natural choice. Autumn Ring mini might be interesting as well since it isn't so speed biased. Maybe Clubman Route 5 since it's moderately fast. Suzuka East looks promising as well.

And don't get hung up over how technical your work is, this took a bit of effort, and I'm sure there's lot of potential for it to get complicated.
 
If I were going to run some laps on another course in the same ~400-500pp range for extra points of data, should I bother with chassis maintenance, or just stick to the engine overhaul?
 
If I were going to run some laps on another course in the same ~400-500pp range for extra points of data, should I bother with chassis maintenance, or just stick to the engine overhaul?

I think chassis maintenance might make a difference, yes. Best way to get stock handling - whether it makes a true, evidential difference in lap-times or not is another experiment all together, really. But why not, it can't hurt.
 
If I were going to run some laps on another course in the same ~400-500pp range for extra points of data, should I bother with chassis maintenance, or just stick to the engine overhaul?

It'd be up for debate.

I tried the chassis maintenance on a couple cars and didn't notice a difference. Granted, it wasn't my objective to test for a difference. But off hand, I couldn't really tell. But then again, I'm using a controller. So I have built-in steering assist I can't turn off.

I've heard it increases understeer. No proof or evidence of this, just rumor. In my experience, as soon as you bump a wall, the car needs it again. So I decided against doing so, but that's just me.
 
I'm using a controller. So I have built-in steering assist I can't turn off.

You can turn it off in the Driving Options menu at the race screen - it goes from -2 to +7 with 0 in between.

I've heard it increases understeer. No proof or evidence of this, just rumor. In my experience, as soon as you bump a wall, the car needs it again. So I decided against doing so, but that's just me.

And bumping a wall won't make a difference - it's based on miles driven, not walls bumped.
 
... In my experience, as soon as you bump a wall, the car needs it again. So I decided against doing so, but that's just me.

That's a fair point that I hadn't even thought of; I think you probably made the right call, considering. I for one don't care to make this take any more tedious work than it already requires, so I think I'll forgo the chassis maintenance when I run my laps.

Edit: And now Iain here is saying otherwise, of course, haha. Okay, I'll run the maintenance before my laps and just not worry about it after.
 
Last edited:
You can turn it off in the Driving Options menu at the race screen - it goes from -2 to +7 with 0 in between.

Doesn't that setting just change steering sensitivity, not assist? I'm pretty sure it just changes the rate at which the driver turns the wheel.

If you try donuts in third person while looking backwards, you'll see the steering assist taking place. Or better yet, just hold the left analog stick all the way in one direction, go to third person, look backwards and slowly increase your speed from zero. You will notice the tires slowly turning back to straight.

Easy to see on an F1 car. I just tested it on the Top Gear Test Track in the Formula Gran Turismo at sensitivity -2, 0 and +7. Neither had an effect on the assist. It only changed steering rate.

I kind of have a problem with this "feature" as well as the ABS in GT5. Feels like ABS also issues some sort of aid on weight transfer. I was thinking of making a thread on ABS and steering assist. It really puts a damper on the game, for me at least. I don't notice the assist as much on GT1, GT2 or GT3. Although the brakes in GT3 are far too good. I'll probably compare all 5 games in the series on the topic of steering assist and ABS. But I digress.

And bumping a wall won't make a difference - it's based on miles driven, not walls bumped.

Thanks for the heads up. Good to know.
 
Okay, I've run four cars but I'm getting kind of tired so I'm gonna stop here for the night.

I'll just go ahead and post all the data I have now and keep this post updated with new results as I get them.
----------

Course: Grand Valley East
Assists: TCS : 1 / ABS : 1 / Grip Reduction : Real
Tunes: Engine Overhaul / Chassis Maintenance / Sport Hard tires

Lotus Europa Special '71 — 132hp / 117ft-lb / 730kg / 411pp
Laps run: 15 / Best on: 11 / Time: 1'23.460"
Notes: Boy this car was loose, I ran two red laps to start trying to get a feel for it, then on lap 3 I put down a time I chased for seven more laps; I was getting ready to call it quits when I dropped a magic lap that beat it by two full seconds, and chased that for a few before finally giving up. It was fun to drive after getting a feel for it, but it was still trying to slide out from under me throughout.

Mitsubishi 3000GT SL (J) '98 — 233hp / 212ft-lb / 1600kg / 408pp
Laps run: 13 / Best on: 8 / Time: 1'21.470"
Notes: Haha, after the Europa this thing is quite the change; from a light, slippery MR to a heavy, planted 4WD. My very first lap felt very slow, but the timer says it was only 1'22.997", and this thing is meant to be lower PP? Suffers from understeer, but less than you'd expect from a 1600kg 4WD; overall not a bad drive.

Mazda KUSABI CONCEPT '03 — 150hp / 135ft-lb / 900kg / 404pp
Laps run: 12 / Best on: 6 / Time: 1'19.960"
Notes: Initial impression: "Holy crap this car feels quick *looks at time* holy crap this car is quick"; my lap times just keep going down right along with the PP. I don't drive very many FF cars, but if more of them handled like the KUSABI I definitely would; this thing is a dream, with the slightest of understeer and amazing breaks I could drive this all night. But we have more cars to run.

DMC DeLorean S2 '04 — 207hp / 222ft-lb / 1288kg / 412pp
Laps run: 12 / Best on: 8 / Time: 1'20.585"
Notes: Oh wow, this car is awful; it's got the understeer of an FF and the slide-happy tail of an FR. It took me four laps to put down one I was even almost happy with, and another four laps to get a halfway good one. This one was just not fun to drive and fought me the whole way.
----------
Chevrolet Corvette Stingray L46 350 (C3) '69 — 365hp / 410ft-lb / 1490 kg / 470pp
Laps run: 12 / Best on: 12 / Time: 1'19.924"
Notes: I am so sorry to the DeLorean that I ever said anything bad about its tail being too slide-happy. So sorry. This car was incredibly difficult to control; I had to be extra careful on the throttle exiting every single corner of the track or it would get away from me and ruin the lap. It took me the full twelve laps to get one where the tail stayed in check the whole time and I didn't take the corner slower than if it had. I don't ever want to drive this car stock again. Also the transmission really hurt this car's time here; with only four gears I hit its top speed of 123 before I even crossed the finish line, so from there to the first right hand I was forced to be slower than the car wanted to be.

Lotus Motor Sport Elise '99 — 211hp / 151ft-lb / 700kg / 490pp
Laps run: 20 / Best on: 18 / Time: 1'16.556"
Notes: This has been one of my favourite cars to drive since GT3, so I was looking forward to this one, though I was a little scared of its stock handling, especially after having to lower its tires from R1 to S1. It was a bit loose but not nearly as bad as the Stingray, and definitely much more fun to drive.

Aston Martin DB7 Vantage Coupe '00 — 439hp / 419ft-lb / 1775kg / 490pp
Laps run: 15 / Best on: 12 / Time: 1'15.750"
Notes: This thing's brakes are just bad; I had to break for the first right at like 180m. Whether it was actually the brakes or just the momentum it carried due to its weight I can't guess, I just know it took an awful long time to stop. Besides the brakes, it had slight understeer going into turns and slipped a bit coming out of them, but overall was pretty easy to drive.

Shelby Series One Super Charged '03 — 335hp / 304ft-lb / 1202kg / 494pp
Laps run: 13 / Best on: 12 / Time: 1'14.115"
Notes: Quick and agile. This car was great to drive, with its only downside being a slippery tail end, but it's not too bad. I set a blistering lap 1 that I couldn't beat until 12, and even then only by four tenths.
----------
Mitsubishi Lancer Evolution VIII GSR '03 — 330hp / 344ft-lb / 1410kg / 479pp
Laps run: 10 / Best on: 6 / Time: 1'14.553"
Notes: I don't know if it's the AYC or what, but this 4WD drives like a dream; if the game hadn't told me it was 4WD I never would've guessed it because there isn't a hint of understeer.

Nissan Skyline GT-R M•spec Nür '02 — 351hp / 365ft-lb / 1580kg / 481pp
Laps run: 15 / Best on: 15 / Time: 1'15.004"
Notes: This is another car that doesn't quite feel like a 4WD, but not in a good way; it's still got some understeer, but its tail will slip out from under you in the exits.

Ford Mustang GT '05 — 309hp / 329ft-lb / 1568kg / 457pp
Laps run: 10 / Best on: 10 / Time: 1'17.358
Notes: Has a bit of understeer, but the tail never slipped out on me so that's good. It felt a bit slow and lumbery, and its time isn't the best, but it wasn't too hard to drive.

Ford Taurus SHO — 244hp / 238ft-lb / 1509kg / 412pp
Laps run: 15 / Best on: 8 / Time: 1'20.618"
Notes: It understeers, it feels slow, it is slow; this is exactly what I expect when I think of FF cars. Not much else to say, except that it did perform roughly on par with the other low-400s so far, so it's not as straight bad on this track as it was on Trial Mountain for GNR1987.
----------
Honda NSX '93 — 284hp / 224ft-lb / 1350kg / 445pp
Laps run: 15 / Best on: 9 / Time: 1'17.429"
Notes: My NSX really wanted to paint that entire first right hander black, and by God did it try its damndest to do so. Even after 15 laps it was still getting away from me, but it wasn't so bad as the Stingray.

Honda NSX '95 — 287hp / 226ft-lb / 1350kg / 446pp
Laps run: 12 / Best on: 7 / Time: 1'18.028"
Notes: I expected this to basically be the same car, but I swear it was harder to control the tail of this one than the '93, and the lap times seem to agree with me.

Honda NSX '97 — 286hp / 231ft-lb / 1350kg / 448pp
Laps run: 12 / Best on: 6 / Time: 1'16.758"
Notes: I don't know if the NSXes are getting better or if I'm getting better at driving NSXes, but this one wasn't too bad; it definitely had a slippery tail but it was manageable.

Honda NSX Type R '92 — 296hp / 235ft-lb / 1230kg / 469pp
Laps run: 12 / Best on: 10 / Time: 1'14.891"
Notes: Well this one was definitely an improvement over the rest, but with 20+ extra PP I would certainly hope so. It handled pretty well, still a slidey tail but nothing too crazy.
----------
Tommy Kaira ZZ-S '00 — 201hp / 152ft-lb / 690kg / 482pp
Laps run: 12 / Best on: 9 / Time: 1'17.291"
Notes: A small, light MR, it drives just how you'd both expect and hope, with a bit of tail slide if you put the power down but not so much as to be impossible to control. I had a blast driving this car, even if it did end up being rather slow for its PP.

Lotus Elise Sport 190 '98 — 196hp / 148ft-lb / 670kg / 492pp
Laps run: 15 / Best on: 4 / Time: 1'17.181"
Notes: A small, light MR, it drives just how you'd expect and fear, with a ridiculous amount of tail slide if you don't manage the power perfectly, and nearly too much to control. I think I put down as many red laps as clean ones in this, it just kept getting away from me. I could see it being fun to dtive, but when racing it was just frustrating.

Oullim Motors SPIRRA 4.6 V8 '04 — 335hp / 330ft-lb / 1205kg / 491pp
Laps run: 15 / Best on: 6 / Time: 1'16.615"
Notes: Ugh, this one was as bad or worse than the Elise Sport 190, with plenty of frustrating oversteer and bad laps run.

Audi RS 6 '02 — 466hp / 431ft-lb / 1840kg / 495pp
Laps run: 10 / Best on: 7 / Time: 1'15.902"
Notes: Drives like your standard 4WD, with a bit too much understeer and a general feeling of slowness around the track.
----------
Hommell Berlinette R/S Coupe '99 — 170hp / 149ft-lb / 950kg / 400pp
Laps run: 13 / Best on: 10 / Time: 1'20.200"
Notes: This car was beautiful to drive, especially after the last two MRs I did. It was quick and responsive with only a hint of tail sliding; I am definitely going to be driving this car again.

Ginetta G4 '64 — 94hp / 99ft-lb / 454kg / 443pp
Laps run: 12 / Best on: 11 / Time: 1'25.520"
Notes: I think this is the slowest car I've done yet, and it's at 443pp? That just seems way off. Though the track probably had some to do with it, because I barely got to use 5th gear at all; it shifted up at 110mph and only ever hit 113. Overall it was an average light MR, with more tail slide than the Berlinette and less than the Elise Sport.

TVR Griffith 500 '94 — 357hp / 368ft-lb / 1060kg / 502pp
Laps run: 8 / Best on: 1 / Time: 1'17.153"
Notes: I hate this car, I had no fun at all driving it, it had horrible understeer and horrible brakes, I couldn't get a single good lap out of it, I gave up after eight laps because it was just frustrating. It probably wouldn't be fair to include this time in the chart because it was such a poor lap, but it really was the best I could make myself do.

Mitsubishi Lancer Evolution VI RS T.M. '00 — 325hp / 315ft-lb / 1260kg / 479pp
Laps run: 13 / Best on: 7 / Time: 1'15.225"
Notes: This LanEvo doesn't have an AYC, and it drives a lot more like a Skyline than the last one, with understeer and a slippery tail, though the tail did take a lot of pushing before breaking loose. I'm not really a fan of such high rear torque splits in 4WD cars, I feel like if you want to drive an FR you should just pick an FR, there are plenty to choose from.
----------
Toyota Tacoma X-Runner '04 — 259hp / 296ft-lb / 1687kg / 421pp
Laps run: 10 / Best on: 4 / Time: 1'20.366"
Notes: Slow and lumbering, with amazing brakes. Its tail will kick out on you if you push it too hard in the exits, but not too much.

Vauxhall VX220 Turbo '00 — 206hp / 193ft-lb / 1005kg / 429pp
Laps run: 11 / Best on: 9 / Time: 1'18.538"
Notes: Slippery, a bit too much for my taste, but not undrivable.

Buick GNX '87 — 288hp / 376ft-lb / 1600kg / 433pp
Laps run: 10 / Best on: 7 / Time: 1'19.870"
Notes: Understeer and tail slide, just what I'd expect from an American car in GT5. At least it had good brakes.

Ford Focus RS '02 — 277hp / 231ft-lb / 1050kg / 442pp
Laps run: 10 / Best on: 10 / Time: 1'17.294"
Notes: Here is another FF that drives well enough for me to actually enjoy it; it has slight understeer but nothing too offensive, and it feels quick.
----------
Acura CL 3.2 Type-S '01 — 271hp / 242ft-lb / 1592kg / 424pp
Laps run: 11 / Best on: 7 / Time: 1'19.657"
Notes: I forgot to write these until after the Legacy was tested, so I guess it didn't leave much of an impression on me. It was a standard FF, with a bit of understeer and nothing special.

Subaru LEGACY B4 RSK '98 — 286hp / 259ft-lb / 1440kg / 440pp
Laps run: 15 / Best on: 15 / Time: 1'18.180"
Notes: I had a hell of a time dealing with this car's understeer. I could not seem to get it to go where I wanted it to at all.

Toyota SOARER 43SCV '01 — 288hp / 332ft-lb / 1730kg / 435pp
Laps run: 10 / Best on: 10 / Time: 1'20.805"
Notes: And here's one where I had a hell of a time dealing with the tail end. It wasn't totally out of control, just slippery enough to scrub tenths off my times if I hit it too hard too early.

Mazda MX-Crossport Concept '05 — 268hp / 293ft-lb / 1600kg / 432pp
Laps run: 10 / Best on: 10 / Time: 1'18.079"
Notes: This thing's got the same magic Mazda concept brakes the KUSABI has, now I'm really curious if Mazda really does put crazy good brakes on their concepts or if PD just increased their effectiveness to make the concept cars stand out against the production road cars. Anyway, this car doesn't say what its drivetrain is but it's a 4WD, and it drives about how you'd expect it to, though its understeer problems aren't as bad as most.
----------
Mazda RX-7 Type R (FD, J) '91 — 264hp / 226ft-lb / 1260kg / 440pp
Laps run: 11 / Best on: 10 / Time: 1"17.636"
Notes: Pretty solid FR, was fun to drive even with its slight tail sliding.

Lotus Evora '09 — 291hp / 265ft-lb / 1330kg / 468pp
Laps run: 10 / Best on: 9 / Time: 1'13.996"
Notes: This was a brand new car, but I took the time (~90 minutes) to break it in so it would be on par with the rest of my UCD car tests. Holy crap this thing is fast, and for an MR its tail is very well behaved. First car I broke 1'14" with, and it's only got 468pp. Crazy.

Lotus Esprit Turbo HC '87 — 224hp / 229ft-lb / 1146kg / 431pp
Laps run: 10 / Best on: 10 / Time: 1'17.422"
Notes: It felt quick, and ran an okay time, but whoa was it ever slippery; I had to be extra careful of my tail end through nearly the whole course, so it was a bit stressful to put down as low a time as I did.

Lotus Esprit V8 '02 — 359hp / 300ft-lb / 1380kg / 485pp
Laps run: 10 / Best on: 7 / Time: 1'14.501"
Notes: This was a brand new car, and I didn't have an hour and a half to break it in so all I did was change the oil. This Esprit was also very slippery. I don't think I like driving these in time trails at all, there is just too much pressure and they slide way too easily.
----------
Lancia STRATOS '73 — 191hp / 171ft-lb / 980kg / 414pp
Laps run: 12 / Best on: 10 / Time: 1'18.734"
Notes: Very slippery tail end, another stressful time trial, but I feel like I got a pretty good time with it.

Mazda RX-7 Type RZ (FD, J) '92 — 261hp / 224ft-lb / 1230kg / 443pp
Laps run: 10 / Best on: 8 / Time: 1'17.175"
Notes: Not a bad drive, if a bit standard FR with a bit of tail slide; felt very much like the '91.

Mazda éfini RX-7 Type RZ (FD) '93 — 265hp / 227ft-lb / 1240kg / 440pp
Laps run: 10 / Best on: 9 / Time: 1'17.378"
Notes: Another fun, if completely expected, FR with just a touch of tail slide; I'm gonna go ahead and skip a few years of RX-7s now, I think.

Mazda RX-7 Type RZ (FD) '00 — 303hp / 253ft-lb / 1270kg / 467pp
Laps run: 10 / Best on: 2 / Time: 1'15.748"
Notes: When I finished my lap and saw the time I was surprised at how much faster this RX-7 was than the previous three, because it felt like it drove just about the same.
----------
Nissan Fairlady Z Version ST (Z33) '02 — 296hp / 280ft-lb / 1450kg / 459pp
Laps run: 10 / Best on: 9 / Time: 1'16.006"
Notes: Boy this car didn't feel much like an FR; it had some understeer and had to be seriously pushed for its tail end to kick loose. Felt very solid, a bit stiff, but wasn't a bad drive.

Mercury Cougar XR-7 '67 — 335hp / 450ft-lb / 1418kg / 469pp
Laps run: 10 / Best on: 10 / Time: 1'18.601"
Notes: Here's another old muscle car with only four gears and a bouncing rev limiter before the S/F line, so it had a hard cap of 118mph and thus an unfortunate and unavoidable reduction in lap time. This time it drove like you'd expect, with ridiculous understeer and not much tail slide in the corners.

Chrysler 300C '05 — 356hp / 408ft-lb / 1878kg / 463pp
Laps run: 10 / Best on: 7 / Time: 1'16.607"
Notes: Wow, from an old American car that wanted another gear, was hard to turn and needed pushing to slide, to a new American car that ignored its top gear, turned well and seemed to think 90° was a perfectly acceptable angle to drive at at all times; I'm not sure I could find two more different cars if I tried. It was fun to drive, and I'm seriously thinking of slapping dome C1s on it and just going to town in a drift competition, but it was difficult to tame into a solid Time Trial lap.

Chevrolet Corvette GRAND SPORT (C4) '96 — 342hp / 354ft-lb / 1496kg / 472pp
Laps run: 25 / Best on: 25 / Time: 1'15.667"
Notes: What a difficult car; at high speed it has heavy understeer and at low speed the tail slides out in the turns. I could not get a solid run until the 25th lap, which is just unacceptable.
----------

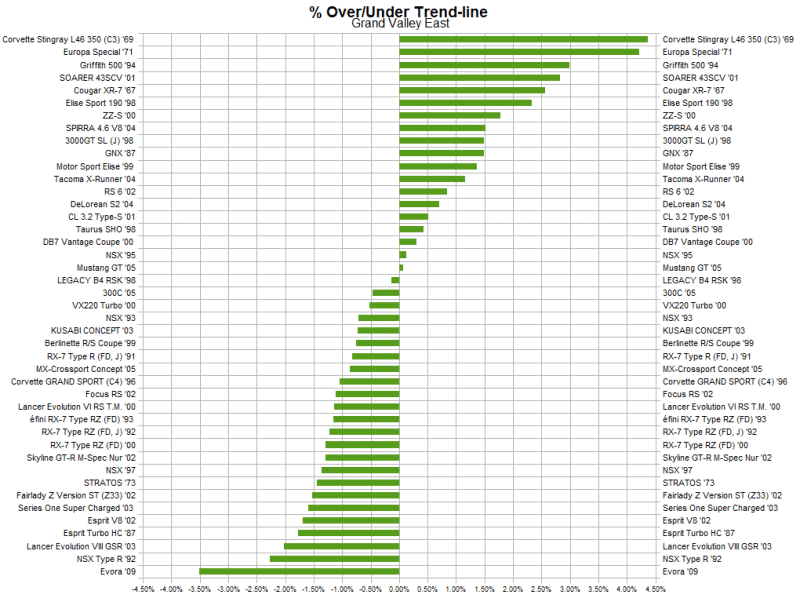
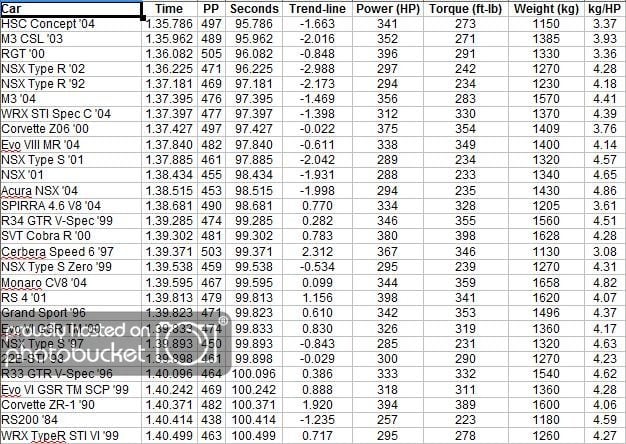
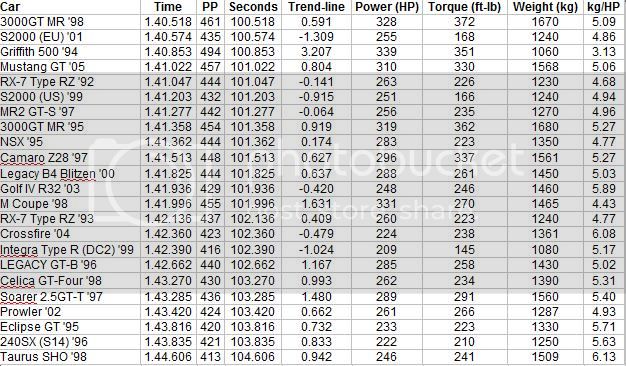
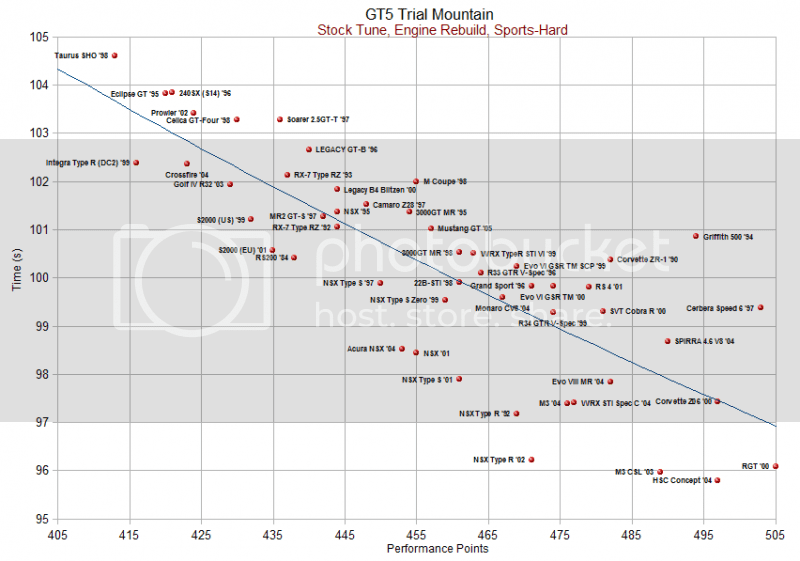
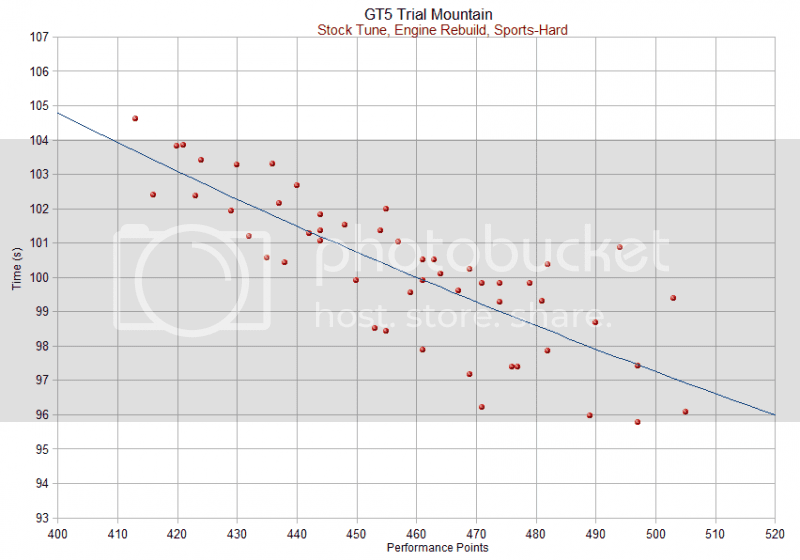
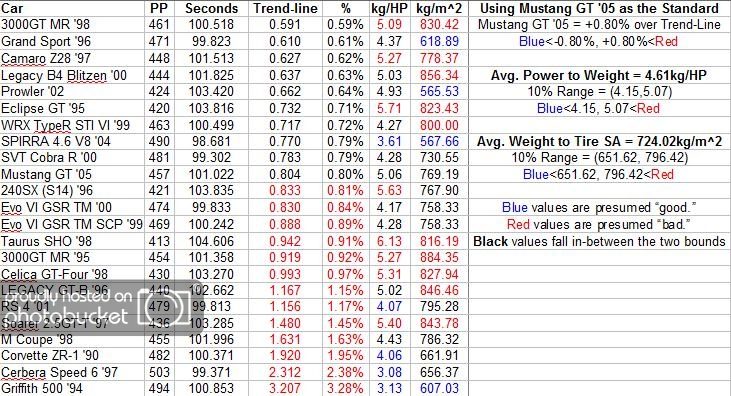
And finally here are the charts and graphs so generously done by GNR1987:

Trend lines, both labeled and not:


And the bar graph:


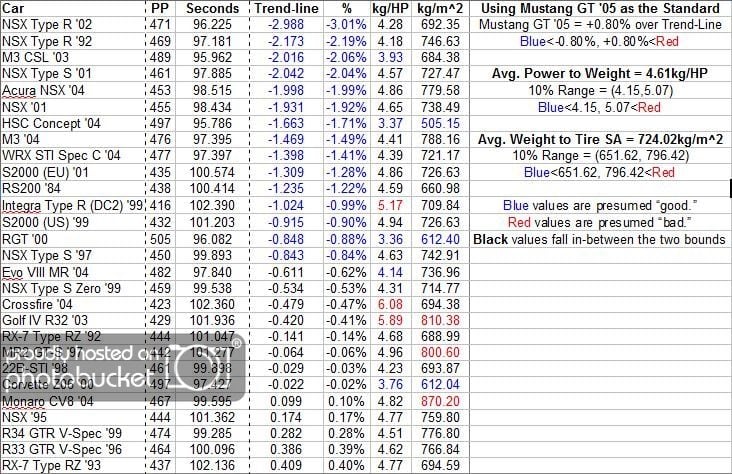
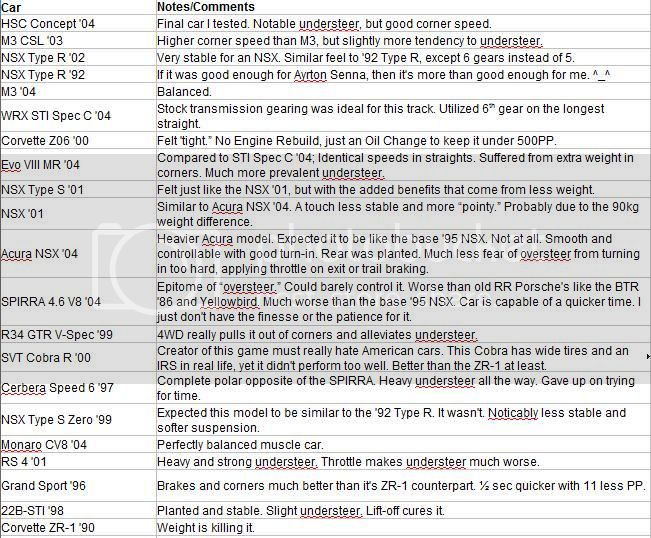
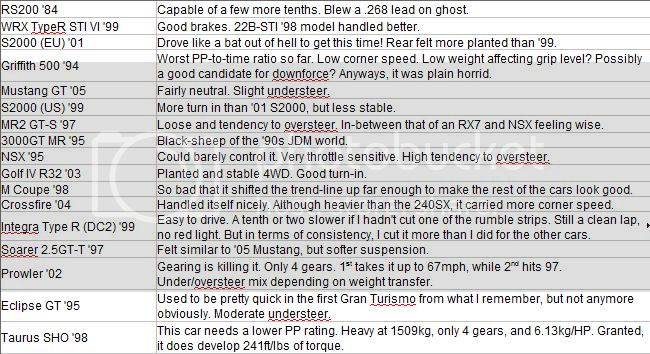
Then a very pretty collection of all the raw data:


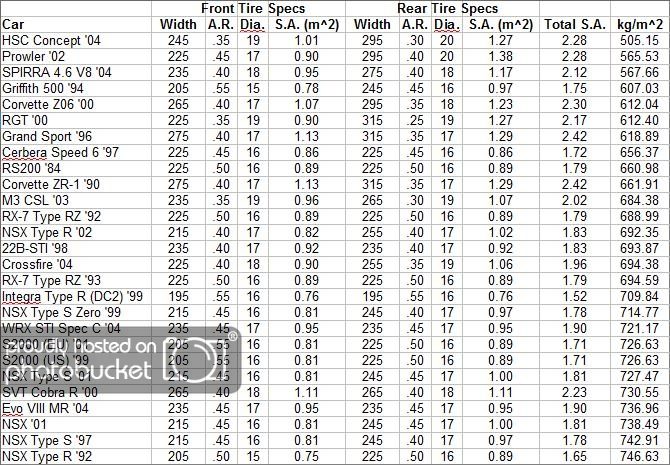
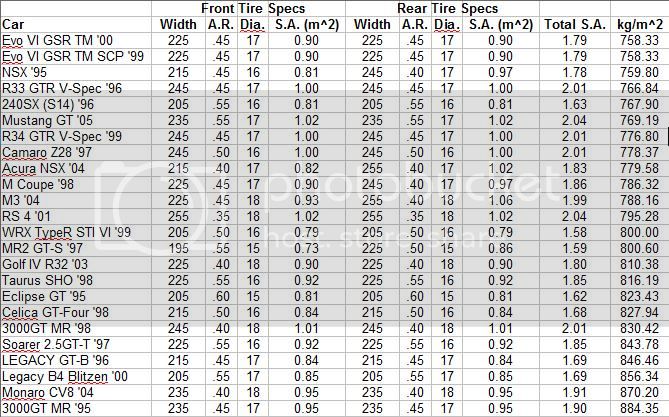
And finally the tire data:


All of these images can be found in vector form, rather than raster as above, in the attached PDF file, which can be found attached to this post.
 
Last edited:
Ran laps and posted times for:
Chevrolet Corvette Stingray L46 350 (C3) '69
Lotus Motor Sport Elise '99
Aston Martin DB7 Vantage Coupe '00
Shelby Series One Super Charged '03

Check my previous post for data.
 
Ran laps and posted times for:
Chevrolet Corvette Stingray L46 350 (C3) '69
Lotus Motor Sport Elise '99
Aston Martin DB7 Vantage Coupe '00
Shelby Series One Super Charged '03

Check my previous post for data.

Awesome posts FFIXMaster! Are you planning on making a spreadsheet and graph for this data?
 
Awesome posts FFIXMaster! Are you planning on making a spreadsheet and graph for this data?
Unfortunately my PC died on me a couple months back and I'm still working on getting a replacement, so all I've got is my phone and that's only really able to post the data here.

You are more than welcome to use my data to create graphs or spreadsheets from if you'd like, though; it was kind of my hope, actually.

This kind of data collecting and graphing is right up my alley, I just can't do the graphing bit myself just now. :)

Edit:
Ran laps and posted times for:
Mitsubishi Lancer Evolution VIII GSR '03
Nissan Skyline GT-R M•spec Nür '02
Ford Mustang GT '05
Ford Taurus SHO

Data can be found with the rest of the cars.
 
Last edited:
You are more than welcome to use my data to create graphs or spreadsheets from if you'd like, though; it was kind of my hope, actually.

No problem. I've created and updated a spreadsheet for you using LibreOffice. I don't have tire data though, just PP vs. Time. Is that okay? Or do you want the tire data as well?

Anyways, I like how clean your post looks. Mine is pretty ugly since I just uploaded pictures of my spreadsheet. The PDF came out decent though. But yours is clean and very easy to read. I think it's gonna look nice with a graph and PP vs. Time table under it! ;)
Oh cool, thanks! You can include whatever data you feel is necessary in the graphs, since you're doing it; beggars can't be choosers, eh? :) Not to mention this is kinda your thread and your theory; I'm just supplying some more data sets.

And haha, thanks also for the praise on my layout; I gave always been very mindful of how I present my data so as to make it easier for people that aren't me to read it. I was actually just wondering if I should leave the cars in testing order or if I should sort them by time/PP instead...
 
Ran laps and posted times for:
Honda NSX '93
Honda NSX '95
Honda NSX '97
Honda NSX Type R '92

I noticed the '97 has one less horsepower and two more PP than the '95, and thought that was kind of interesting. It's obviously not just the power:weight ratio taken into consideration.
 
I noticed the '97 has one less horsepower and two more PP than the '95, and thought that was kind of interesting. It's obviously not just the power:weight ratio taken into consideration.

I have a feeling that handling also affects PP. But that was just a conclusion someone made after the previous update that altered PP ratings and made heavy hard to handle cars with lower PP.

I mean let's use the X2010 5G as an example. The 5G has 400BHP, 545kg and 70f 90r max aero, but still has about 800PP. Now with those stats the car wouldn't normally have such high PP were handling not taking into consideration as well.
 
Last edited:
I noticed the '97 has one less horsepower and two more PP than the '95, and thought that was kind of interesting. It's obviously not just the power:weight ratio taken into consideration.

Very interesting. Especially considering both the '95 and '97 weigh 1350kg sport 215/45/16 tires up front and 245/40/17's in the rear.

A few points/questions to consider:

  • Do they have the same weight distribution? Maybe the '97 has a point or two more toward the rear?
  • Another point to consider is the engine. The NSX's engine was bored out to a 3.2L in '97(I think) from the previous 3.0L size. Maybe the '97 develops more torque? Maybe it holds a flatter hp or torque curve, thus making the integral, or area under the curves larger than that of the '95?
  • 6spd vs 5spd?

Anyways, great data. I'm going to log it into the spreadsheet now.
 
This is a really good analysis buddy. Love your efforts here! The Above/below graph summaries it all :)
 
Very interesting. Especially considering both the '95 and '97 weigh 1350kg sport 215/45/16 tires up front and 245/40/17's in the rear.

A few points/questions to consider:

  • Do they have the same weight distribution? Maybe the '97 has a point or two more toward the rear?
  • Another point to consider is the engine. The NSX's engine was bored out to a 3.2L in '97(I think) from the previous 3.0L size. Maybe the '97 develops more torque? Maybe it holds a flatter hp or torque curve, thus making the integral, or area under the curves larger than that of the '95?
  • 6spd vs 5spd?
From the Description ingame:
"In February 1997, the NSX underwent its most significant change. The biggest difference was its engine, the 3L C30A engine was replaced by a new 3.2L C32B unit.

The C32B was not just a bored out version of the C30A. The cylinder liners were fibre reinforced metal, and the weight of the engine block was reduced by 3kg. The intake and exhaust system as updated, while maximum power did not change, maximum torque was produced at 100rpm lower than before, with an additional 7.2 ft-lb of torque, producing 224.2 ft-lb at 5500rpm.

The manual transmission was finally upgraded to a 6 speed. The gears up to 5th were cross-ratio gears and a 6th gear that was 7% higher in gear-ratio than the conventional 5th gear that was added.

Overall handling was improved by fine tuning the suspension, brakes and steering input. The aluminum body was reduced in weight and reinforced front / rear brake disc rotors were made 16 inches, adding refinements to almost everything about the car."


So yeah, you were right on just about all counts. You can actually see the stock spring rates front and back were made 0.3 stiffer, but besides that and the new gear in the transmission everything looks the same, which is weird with all their talk of weight reductions; that is a bit confusing.

Also, ran laps with and posted times for:
Tommy Kaira ZZ-S '00
Lotus Elise Sport 190 '98
Oullim Motors SPIRRA 4.6 V8 '04
Audi RS 6 '02

Double also, I went through and added ft-lb data for all my tested cars.
 
Excellent work.

Nice when you do a few tests and plot the times up.

Well worth a second peruse - Griffith the worst car... Silly PP system!
 
I mean let's use the X2010 5G as an example. The 5G has 400BHP, 545kg and 70f 90r max aero, but still has about 800PP. Now with those stats the car wouldn't normally have such high PP were handling not taking into consideration as well.

Do you mean handling, as in the qualitative feel of the car? I wouldn't think that would factor into PP. It would be difficult to assign to a number, and it would have to be hand coded for each car. There are underlying quantitative numbers that factor into handling ("feel") and cornering (speed/composure through a turn) that are more likely to be used in PP calculation.

Also for race cars, it wouldn't surprise me to see that there are hidden downforce stats. I would guess from experience that the downforce stats we see are wings only, but don't include undertrays, especially rear diffusers.

It certainly doesn't include fans. The X1 has the same downforce as F1 cars according to the stats.

So yeah, you were right on just about all counts. You can actually see the stock spring rates front and back were made 0.3 stiffer, but besides that and the new gear in the transmission everything looks the same, which is weird with all their talk of weight reductions; that is a bit confusing.

Odd that suspension would change PP for stock cars, but adding race suspension does nothing.
 
Back