- 168

- Milano, Italia
Hello to everybody; recently I had to perform some Matlab/Octave coding at the university and I thought of applying some of the concept to a tool which could be used by GT users to test/understand/modify their gear ratio settings. The result is this "beta", which is stable, working and gives good results, but isn't, by now, easy to use yet.
Requirements.
You need to have Octave installed onto your computer. Octave is a free GNU program used for numerical calculation. It is completely free, and it takes some 150Mb to install. It is compatible with Windows, Linux and (I presume) Mac OS X.
If you have installed Octave, just paste the downloadable folder which contains the tool in any known location, and then change the working folder of Octave to the folder which contains the .m files. Then you're ready to use the program.
Use.
This tool can have many uses. You can use it to check the gear ratios of your car, to calculate its acceleration between one speed and another, and the time required to cover a certain distance starting from a given speed.
Getting the car data
To do this, you will have to get all the necessary data from your car, that is, from the Car Setup menu of GT6, or equivalent in previous GT versions. You'll need to take note of:
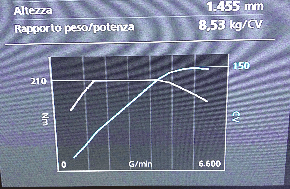
You need to take note of some (5 to 10) coordinates which compose the torque graph. For example, here we see a very flat torque curve and we'll note «0,140; 1,180; 1.4,210; 4.3,210; 5,195; 6,160; 6.6,150.
While the second number in the couples is the torque in Nm (the height of the curve in the graph), the first number is the abscissa at which we read it. Since our graph doesn't say which is the number of RPM we are reading those at, we just take note of them as we see them, taking advantage of the white vertical lines which will be 1,2,3,4,5 and 6.
When we put those data into dati.m, we should see something like this:
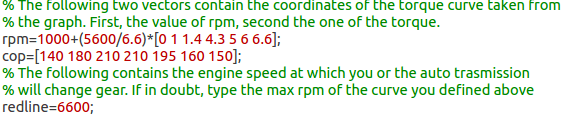
So, in the abscissa vector, which is called rpm, we just build the vector with the standard Octave syntax: [0 1 1.4 4.3 5 6 6.6], and then we assume that the graph starts at 1000rpm (The graph doesn't say it) and that, if it ends at 6600, we must scale it by a factor
(6600-1000)/(6.6)=5600/6.6
The torque value, which we must put into the following line, are a lot simpler, as you only need to copy them as they are. Also, remember to type the redline rpm value in the redline line.
Once you copied rpm and torque values, go to the Octave Command Window and type main. Depending on your version of Octave, either a window or a textual menu will show up.
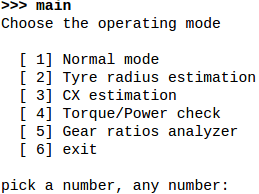
At this point, choose option 4, «Torque/Power check».
A graph will show up. The curve in red is the torque, and the one in blue is the power. If you made things correctly, your curves should be pretty similar to the ones shown in GT6. If not, try to adjust the rpm abscissa with other values (for example, 500+6100/6.6*[...]).
Even if the curves are similar, you may end up with pretty different powers. On the screen, you should be able to read how high and where the power peak is. If this is considerably lower or higher than the one read in GT6 (eg. more than 5%) try re-scaling rpm abscissa and see if and how that number changes. This step is quite important because if you define a wrong torque curve, the mistake will be brought on through the whole process.
If your Torque/Power curves are good, proceed copying the mass data into dati.m. Remember that this should be done in Kg and not lbs.
Done this, take note of the gear ratios and final ratio, and copy them into dati.m, eventually substituting data already there.
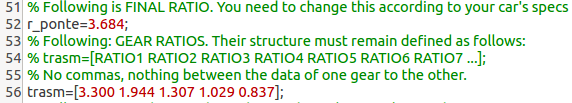
Don't worry if your gears are more (or less) than in the original trasm vector: the program is made in such a way that this shouldn't cause any mistake.
Once you did this, call again the main program (Type main and then enter in the command window). Now, you can choose option 5, "gear ratios analyzer". Here, you'll be prompted to insert a gear (1 to your tallest gear). Type, for example, 3, and press Enter: the program will tell you which is the speed and rpm in which gear 3 will kick in, and highlight that rpm on the torque-power curve graph.
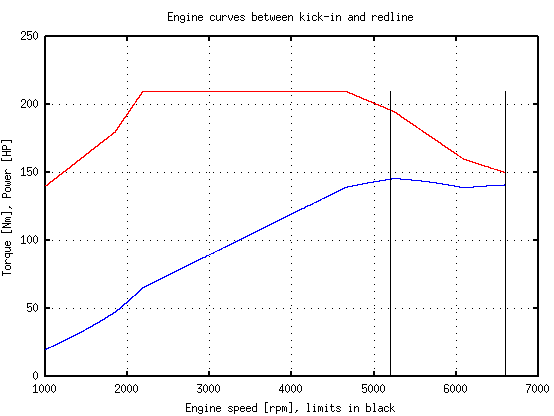
So you can now see, between the two black lines, in which range of operation each gear falls. This can be useful sometimes to avoid having gears fail exploiting all the power of your engine.
If you correctly put in engine, mass and transmission data, you are ready to proceed to the next step.
Other data: testing the car
Take your car to a test track which is long enough to see the maximum speed. Make sure that the track is flat enough, and that the max speed isn't reached because of gearbox limit (for example, what happens with old, powerful muscle cars. You want that the max speed you read here is reached far from the rev limiter, for example at 5500rpm against 6600 redline).
You'll have to perform 2 tests:
First, reach the redline in 3rd or 4th gear. Take note of the maximum speed you've reached, convert it to km/h (multiply by 1.609 if you see it in mph) and of the redline speed. For example, here we have, in 3rd gear, 157km/h at 6600rpm.
Then, call the main function (type 'main' then Enter) and choose 2. 'Tyre radius estimation'. You'll be asked for the data you just took note of, and for the gear ratio and final drive. Put data in and press Enter. The program will display a value which is the radius of your tyre.
Once you have this, put that value into 'dati.m' in the correct line (line 38, raggio=...), and proceed to the next test.

Try to reach the maximum speed of your car. Once you have that data, take note of it and call the main function. Now, choose 'Cx Estimation'. The program will ask you for the maximum speed, and will return a value which you should take note of, and put into 'dati.m' in line 45.

Now, we have all the data.
Simulating the car acceleration
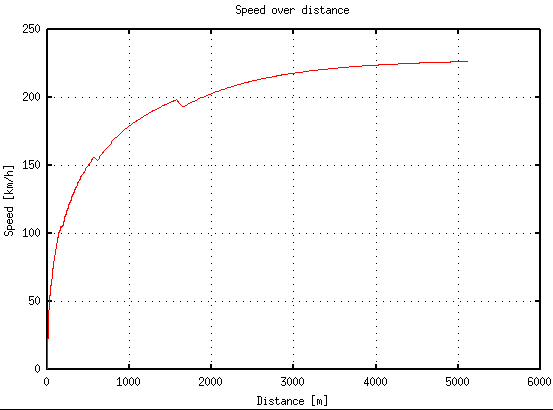
If you call the main function now, you can finally choose 'Normal mode'. The program will simulate the acceleration of your car from 0km/h and for a total duration of a number seconds (and with a time-step) that you'll be asked to define. Be cautious, aso this is a long process, and, if you stick to the default 100 seconds with 0.25 step (enough for most cars to reach their maximum speed), Octave can freeze for 5 to 30 seconds depending on how fast your computer is. My oldest one is a Pentium 4, and it managed to give results in 15-20s. An example of the speed-distance graph for a VW Golf is seen here:
You should now see graphs with speed over time, speed over distance and acceleration over speed. Another menu will be shown, and now you can choose between 3 options:
1. Acceleration at a given speed
Type the speed and press Enter. The program will tell you how high the acceleration is in that speed (in (km/h)/s, that is how many km/h you'll gain in one second starting from that speed).
2. Time for v1 to v2
This will tell you the time necessary for your car to go from speed 'v1' to speed 'v2'.
3. Time for x space from v1
This will compute the time necessary to make 'x' meters of distance starting from speed 'v1'. This is useful to compute, roughly, how long it will take to complete a straight part of the track knowing the exit speed from one corner. With this option, you can take note of some of the straights of your track and of the exit speeds and compare different gear configurations to see which one suits the track best.
Conclusion
And this is it. Now, you might be wondering how precise this is, and the answer is, not much. I mean, I tested this comparing the results both with GT6 and with real tests made by magazines, and the mistake can be as high as 10% on the acceleration times. This happens because the physical model behind is very, very semplicistic. I'd say this is the simplest model which will actually give acceptable results. However, it can be used as a tool to understand how the car performs when you change one or more parameters. For example, if you change one gear, you'll notice some changes on the speed over distance graph. If you change the final ratio, you'll notice a variation in the maximum speed, and so on. You can even go to 'dati.m' and try changing data about the friction coefficients, and the Cx, the redline, or even air density, to see what happens to the performance of your car.
So, you can use this both as a tool to find 'promising' gear configurations to further improve testing, and as a numerical model to enhance your confidence with the physical parameters behind a car and how they affect the car itself. Enjoy!
Requirements.
You need to have Octave installed onto your computer. Octave is a free GNU program used for numerical calculation. It is completely free, and it takes some 150Mb to install. It is compatible with Windows, Linux and (I presume) Mac OS X.
If you have installed Octave, just paste the downloadable folder which contains the tool in any known location, and then change the working folder of Octave to the folder which contains the .m files. Then you're ready to use the program.
Use.
This tool can have many uses. You can use it to check the gear ratios of your car, to calculate its acceleration between one speed and another, and the time required to cover a certain distance starting from a given speed.
Getting the car data
To do this, you will have to get all the necessary data from your car, that is, from the Car Setup menu of GT6, or equivalent in previous GT versions. You'll need to take note of:
- Torque curve
- Mass
- Gear ratios
You need to take note of some (5 to 10) coordinates which compose the torque graph. For example, here we see a very flat torque curve and we'll note «0,140; 1,180; 1.4,210; 4.3,210; 5,195; 6,160; 6.6,150.
While the second number in the couples is the torque in Nm (the height of the curve in the graph), the first number is the abscissa at which we read it. Since our graph doesn't say which is the number of RPM we are reading those at, we just take note of them as we see them, taking advantage of the white vertical lines which will be 1,2,3,4,5 and 6.
When we put those data into dati.m, we should see something like this:
So, in the abscissa vector, which is called rpm, we just build the vector with the standard Octave syntax: [0 1 1.4 4.3 5 6 6.6], and then we assume that the graph starts at 1000rpm (The graph doesn't say it) and that, if it ends at 6600, we must scale it by a factor
(6600-1000)/(6.6)=5600/6.6
The torque value, which we must put into the following line, are a lot simpler, as you only need to copy them as they are. Also, remember to type the redline rpm value in the redline line.
Once you copied rpm and torque values, go to the Octave Command Window and type main. Depending on your version of Octave, either a window or a textual menu will show up.
At this point, choose option 4, «Torque/Power check».
A graph will show up. The curve in red is the torque, and the one in blue is the power. If you made things correctly, your curves should be pretty similar to the ones shown in GT6. If not, try to adjust the rpm abscissa with other values (for example, 500+6100/6.6*[...]).
Even if the curves are similar, you may end up with pretty different powers. On the screen, you should be able to read how high and where the power peak is. If this is considerably lower or higher than the one read in GT6 (eg. more than 5%) try re-scaling rpm abscissa and see if and how that number changes. This step is quite important because if you define a wrong torque curve, the mistake will be brought on through the whole process.
If your Torque/Power curves are good, proceed copying the mass data into dati.m. Remember that this should be done in Kg and not lbs.
Done this, take note of the gear ratios and final ratio, and copy them into dati.m, eventually substituting data already there.
Don't worry if your gears are more (or less) than in the original trasm vector: the program is made in such a way that this shouldn't cause any mistake.
Once you did this, call again the main program (Type main and then enter in the command window). Now, you can choose option 5, "gear ratios analyzer". Here, you'll be prompted to insert a gear (1 to your tallest gear). Type, for example, 3, and press Enter: the program will tell you which is the speed and rpm in which gear 3 will kick in, and highlight that rpm on the torque-power curve graph.
So you can now see, between the two black lines, in which range of operation each gear falls. This can be useful sometimes to avoid having gears fail exploiting all the power of your engine.
If you correctly put in engine, mass and transmission data, you are ready to proceed to the next step.
Other data: testing the car
Take your car to a test track which is long enough to see the maximum speed. Make sure that the track is flat enough, and that the max speed isn't reached because of gearbox limit (for example, what happens with old, powerful muscle cars. You want that the max speed you read here is reached far from the rev limiter, for example at 5500rpm against 6600 redline).
You'll have to perform 2 tests:
First, reach the redline in 3rd or 4th gear. Take note of the maximum speed you've reached, convert it to km/h (multiply by 1.609 if you see it in mph) and of the redline speed. For example, here we have, in 3rd gear, 157km/h at 6600rpm.
Then, call the main function (type 'main' then Enter) and choose 2. 'Tyre radius estimation'. You'll be asked for the data you just took note of, and for the gear ratio and final drive. Put data in and press Enter. The program will display a value which is the radius of your tyre.
Once you have this, put that value into 'dati.m' in the correct line (line 38, raggio=...), and proceed to the next test.
Try to reach the maximum speed of your car. Once you have that data, take note of it and call the main function. Now, choose 'Cx Estimation'. The program will ask you for the maximum speed, and will return a value which you should take note of, and put into 'dati.m' in line 45.
Now, we have all the data.
Simulating the car acceleration
If you call the main function now, you can finally choose 'Normal mode'. The program will simulate the acceleration of your car from 0km/h and for a total duration of a number seconds (and with a time-step) that you'll be asked to define. Be cautious, aso this is a long process, and, if you stick to the default 100 seconds with 0.25 step (enough for most cars to reach their maximum speed), Octave can freeze for 5 to 30 seconds depending on how fast your computer is. My oldest one is a Pentium 4, and it managed to give results in 15-20s. An example of the speed-distance graph for a VW Golf is seen here:
You should now see graphs with speed over time, speed over distance and acceleration over speed. Another menu will be shown, and now you can choose between 3 options:
1. Acceleration at a given speed
Type the speed and press Enter. The program will tell you how high the acceleration is in that speed (in (km/h)/s, that is how many km/h you'll gain in one second starting from that speed).
2. Time for v1 to v2
This will tell you the time necessary for your car to go from speed 'v1' to speed 'v2'.
3. Time for x space from v1
This will compute the time necessary to make 'x' meters of distance starting from speed 'v1'. This is useful to compute, roughly, how long it will take to complete a straight part of the track knowing the exit speed from one corner. With this option, you can take note of some of the straights of your track and of the exit speeds and compare different gear configurations to see which one suits the track best.
Conclusion
And this is it. Now, you might be wondering how precise this is, and the answer is, not much. I mean, I tested this comparing the results both with GT6 and with real tests made by magazines, and the mistake can be as high as 10% on the acceleration times. This happens because the physical model behind is very, very semplicistic. I'd say this is the simplest model which will actually give acceptable results. However, it can be used as a tool to understand how the car performs when you change one or more parameters. For example, if you change one gear, you'll notice some changes on the speed over distance graph. If you change the final ratio, you'll notice a variation in the maximum speed, and so on. You can even go to 'dati.m' and try changing data about the friction coefficients, and the Cx, the redline, or even air density, to see what happens to the performance of your car.
So, you can use this both as a tool to find 'promising' gear configurations to further improve testing, and as a numerical model to enhance your confidence with the physical parameters behind a car and how they affect the car itself. Enjoy!