Gr.1, Gr.2, Gr.3, Gr.4, Gr.B - BoP Tables

1,743
Australia
Aussie
Tassie_tiger
I've noticed a few posts recently talking about BoP values, so I'm happy to share a spreadsheet I've been maintaining for a while.

It's a google docs spreadsheet.
It has 5 main sheets, one for each Group.
And each sheet has multiple tables, each one sorted from best to worst, using the data as provided by PD for each category (with an additional Power/Weight column).

As an example:

39665143954_3c240d0a1c_k.jpg


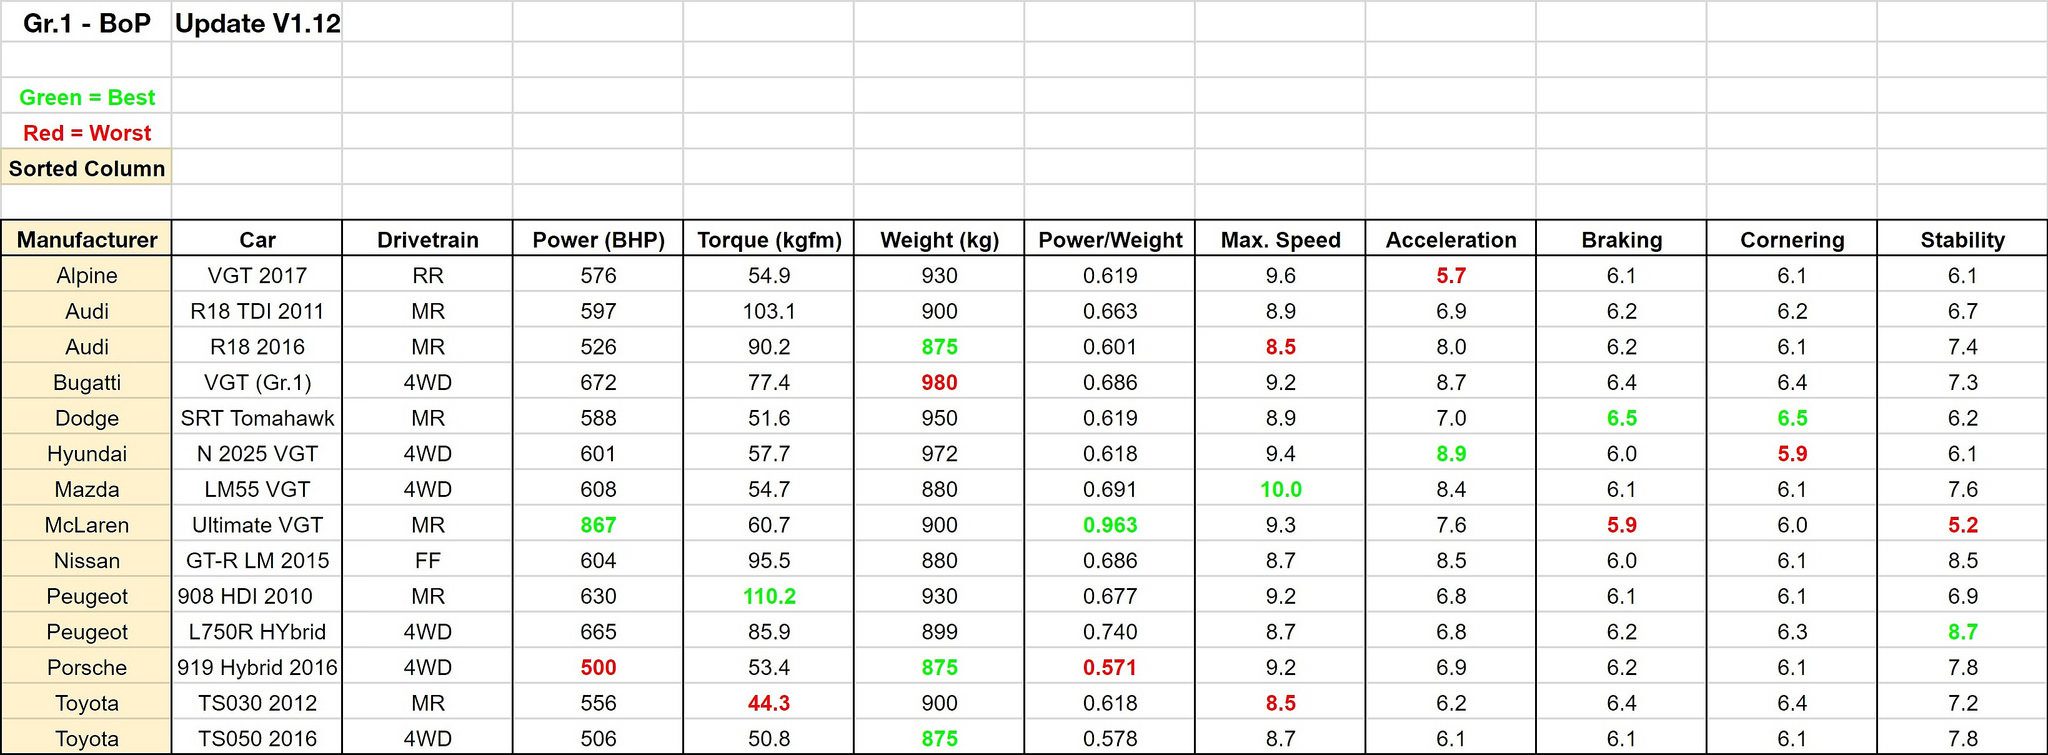
In addition to the latest data, extra sheets are available to view archived BoP figures from previous versions.
eg. Gr.3 - v1.05, v1.10, etc.


I try to update the spreadsheet when new BoP figures are released.
Though sometimes it takes a while before I find the time.
The spreadsheet is currently fully up to date with the latest numbers from v1.38.


The link for the spreadsheet is below:
docs.google.com/spreadsheets/d/1m0aiqRjpDIuEybXqN_uz2JRspckL-Vqz-BHVPfPSzis/edit?usp=sharing


Some may not get much from it.
But for those that like looking at numbers ... enjoy.

:cheers:
 
Last edited:
Its interesting that in Gr3 the Mustang dominates Monza with it having the best power/weight ratio, and the Corvette C7 dominates the hilly Bathurst with it having the best torque.

Nice stats 👍

It should dominate ovals too... (in theory... at least)
 
Nice, I like working at data.

For now I personally test different cars on two different tracks with BoP enabled, one for speed (Tokyo East inner loop, going from offramp through the tunnel at top speed) and one for technical (Interlagos) in arcade time trial.
 
I guess once up to speed, the power/weight doesn't matter as much as torque?

@Tassie_tiger looking forward to how this spreadsheet evolves as new BOP adjustments are made, please put them on a new sheet and keep the existing data to look back historically.
I've been doing this since mid November.
So I happened to have archived versions of V1.05 and V1.10.

I've just added them to the spreadsheet. 👍

I wasn't sure about the best way to do it, so I duplicated the V1.12 sheets and then input the appropriate data for the other versions.
 
Yeh, I haven't seen anyone dig into the stats yet,

Is cornering - the high speed cornering grip max speed?
Is acceleration - up to x miles per hour, or up to cars max speed?

What I enjoy seeing, is that the 991 is far from dominating any stats, on paper it is terrible.

The McLaren is a sign of the times I suppose, hopefully their 2018 F1 season will encourage PD to make it a better car in game.
 
Although I do not necessarily agree with all these values, but at least according to the game numbers itself, the MR category is inherently disadvantaged.

FRMR.png
 
I think, however those numbers are determined, they're clearly unreliable, unless anyone agrees that the GT by Citroen accelerates better than the Mustang. And the Mustang corners better than the GT by Citroen.
Unreliable?

Yeh, possibly.
But I think it's more because we don't really understand how the values are determined.
It would be a bit like me finding a stat (let's say, the LM55 has the highest top speed) and if it does then therefore all these numbers are reliable.
I don't take them as gospel, but I think they are a reasonable guide for comparisons sake.

I haven't played around with it for ages.
But if you turn BoP on and allow tuning, adjusting the values for suspension, gears, etc. will show real time changes to the "scores" for acceleration, cornering, etc.
I've even tried to tune a car by doing nothing more than adjusting sliders aiming to get the highest score I could on each category, and therefore the best alround setup.
It didn't go too well, and my own tune created by driving/testing (with lower scores) was a far better setup.
So in that example, unreliable is a fair call.
And I can see that being the case quite regularly when using/testing different cars on different tracks, but I'm not sure we should therefore just discount all these numbers entirely.


From memory acceleration is largely only influenced by first gear and final drive.
Max. speed similarly is mainly only last gear and final drive.
All other gears seem to have no effect.
Camber and ride height though will also change these scores.

Ride height and camber seem to work together for "cornering".
I don't recall toe having any noticeable effect.

In general, camber seems to be the factor that will influence all scores most commonly.

*Edit*
And of course, tyre compounds.
I wouldn't be surprised if this is a major factor behind why all Daily Races are always being run on Racing Hards.
I could see a whole new set of BoP settings being necessary when using different rubber.
 
Last edited:
Great lists/information @Tassie_tiger

I'm doing work on the actual cars themselves in terms of what their actual pace is with BoP and I'm focusing Gr3 to begin with. It's going to be very interesting how these values correlate with the times I'm doing.
Nice work.

I imagine there will be some rather interesting results. :sly:
 
@Tidgney what track were you thinking of testing on?

I don't think I have all the Gr3 cars, but I'm curious to test myself, I'll pick a different track.

I'm testing on 5 tracks and combining the results to try get a good overall picture for each car. I'm also going to (after I've got the final results) change the BoP values where I can (Weight can only be max 105% by user input so I'll be changing power more) to try and close the gaps where possible.

First car profile is out (another 1 today actually) but I'll probably start my own thread with the results to be honest as I know there's a few people interested :D. I also don't want to hijack Tassie_tigers thread :P!

Nice work.

I imagine there will be some rather interesting results. :sly:

Definitely will be :P.
 
A heads up, for those that are interested, that the spreadsheet has been updated for the BoP changes in v1.15. 👍
The link to view the spreadsheet is in the opening post.

As usual I test 2 random cars in each "Group" that haven't been adjusted to confirm their numbers have not changed.
Then I change the numbers for the adjusted cars, according to the list provided by PD, and then re-sort the tables.
https://www.gran-turismo.com/au/gtsport/news/00_3053440.html


Gr.1 is unchanged.

Gr.2 is a new sheet.
This is based on Open Lobby numbers only (although from my experience it will be the same numbers for Sport Mode).
The lobby was set with Circuit BoP On, Tuning Prohibited, and Racing Hard Tyres.

Gr.3 has been adjusted for 8 cars.
The new Lexus RC F GT3 (Emil Frey Racing) '17 (Gr.3) car has been added.

Gr.4 has been adjusted for 14 cars.

Additional sheets have been added to archive v1.12 numbers for Gr.3 and Gr.4.


:cheers:
 
Last edited:
@Tassie_tiger Awesome work.
Where are you getting the TQ values?
and, guessing the TQ values are BoP'd since your HP value is...?
I have a spreadsheet I've been working on, and am doing HP (would like to add TQ) and adding a rpm range for where the car makes 90% of it's power... at some point I may run a shift point calc on them...
 
Last edited:
Cool work! Maybe it is possible to add a overall rating column? Just sum up all values expect weight and divide it trough the columns count... just to see which car has the best values...?!
 
Two drivers in the 911 RSR both did a 1:30.0 on Interlagos. I checked the table to see how that car might be so strong on that track, but it looks really poor on paper?
 
Thanks for putting this together. My first thoughts with some of these cars are confusing.

For example, when comparing somewhat-similar cars like the Viper and Corvette
The Chevrolet has more Power, more Torque, less Weight. Yet, it has the same Top Speed and LESS Acceleration? I know it's just a game but some of the values are quite off of what I perceive the real cars qualities would be (from watching countless amounts of racing on television and in person).

Anyone have similar thoughts on this subject?
 
@Tassie_tiger Awesome work.
Where are you getting the TQ values?
and, guessing the TQ values are BoP'd since your HP value is...?
I have a spreadsheet I've been working on, and am doing HP (would like to add TQ) and adding a rpm range for where the car makes 90% of it's power... at some point I may run a shift point calc on them...
Sorry for the delayed reply.
I've been away from home for a while.

It's simply a matter of having every car in the class, entering them into the event qualy, and then checking the settings sheet. 👍
So yep, they are the official BoP Torque figures.

Speaking of which, I'm a little behind at the moment.
I'll find some time in the next few days to update the spreadsheet. :)

Cool work! Maybe it is possible to add a overall rating column? Just sum up all values expect weight and divide it trough the columns count... just to see which car has the best values...?!
Yeh, I have thought about doing something like that.
Some sort of average score.
And although it seems a good idea, some of the stats. an be a bit misleading.

It's been a while since I looked into it, and I didn't go very deep with it.
But as an example, just altering first gear changes the "Acceleration" number.
And how often do you hit first gear when racing?
Some other numbers can also be manipulated in similar ways.
So while it would be easy enough to add an some sort of overall scoring column, I've opted to just stick with the raw numbers PD gives us. 👍
 
Back