Thorin Cain
Premium
- 2,298

- Glasgow
- THORIN-RAYVEN
I was playing with the MoTec data tonight to find an easier way to compare settings.
A few issues:
1.) Comparing lap times from a full lap is not showing enough of the story. For example, if 0 camber and 1.0 camber produce very similar lap times, what have we learned... that both settings work? Maybe, but there may be a deeper story looking at sector times.
2.) Lateral Gs seems promising, but looking at max Gs is troublesome. A driver could have entered super late and grabbed an extra bit of wheel causing a spike in Gs. Or a super smooth driver hit his marks perfectly and the lateral Gs did not reach the maximum grip of the tire. Maybe average Gs is more comparable?
3.) Steering wheel angle has the same problem as lateral Gs. Maybe looking at average angle is best?
4.) Corrected speed is also difficult to view simply max speed. Maybe average speed is best?
So I was thinking through the issues above and came to a conclusion. Sector lap time is the only thing that truly matters. All of the other measures above are attempts at proving the same thing, but are really surrogates to the most important measure. How fast were you able to get the car through each sector?
So here is how I think we should measure results (more standardized testing):
1.) Run say ten laps with a setting then save the entire replay, not just the fastest lap.
2.) Export the full ten lap replay to the MoTec Pro tool.
3.) Create custom sector splits for the test track (the default settings are too granular for easy comparison).
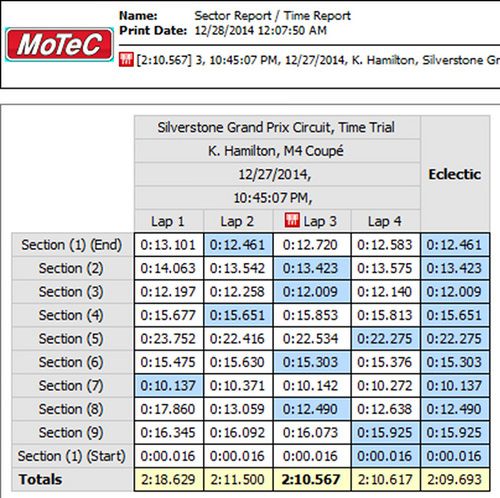
4.) Use the Eclectic column of time (as @LeoStrop has posted above) for comparison of each setting. This view shows essentially your theoretical fastest lap. We use this data most often with our real world data collection.
In a ten lap run, even non alien drivers should be able to hit each sector with a quick time. This eliminates the worry about blowing one corner and wasting the whole lap. Mess up sector one and you could still collect useful data. I ran a few laps just to collect some source data so please don't scrutinize the lap time inconsistency.
More simple and meaningful comparison? Thoughts?
I agree. I think this is a much better way to collect and perform a good analysis on the lap times. Using the eclectic times should paint a better picture of where the camber is helping or hindering the car's performance. It does help reduce the impact on the results which are due to the inconsistencies of us humans.
Oh, @DolHaus I have a confession to make. I was only using the standard version of this software and was actually analysing the graphs rather that relying on just a data sheet (I think you get a better picture of what is happening if you can actually see the picture
") .) I also suffer from man disease and tend not to use instruction manuals too much, so I don't even know if this was in the standard version. But I have the PRO version now so it's all good.
.) I also suffer from man disease and tend not to use instruction manuals too much, so I don't even know if this was in the standard version. But I have the PRO version now so it's all good.And speaking of which....
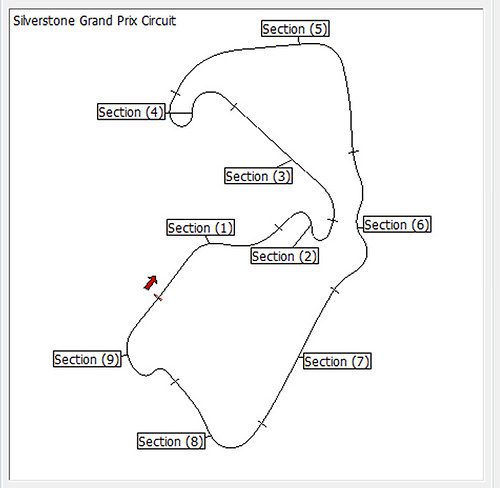
I booted up Motec when I got back in from work and checked the Track layout and the time data sheet. Here are the corresponding sectors. I have also noted the camber settings which were fastest through each sector, the time differences between the 1st - 2nd fastest setting and 1st'lastThis is what the @LeoStrop data looks like using the above method.
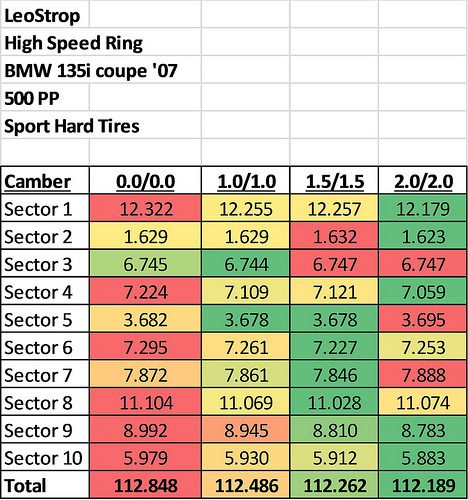
I wish that I knew what the section map looked like for High Speed Ring. That could help understand which types of corners line up with the data. This test shows that the fastest sectors were achieved when using 1.5 and 2.0 degrees of camber. It is interesting that the sector times are nearly opposite for 1.5 and 2.0, meaning that where 1.5 is strong, 2.0 is not.
Track Sectors----Camber @ ---- Diff. from 2nd ---- fastest-slowest
1: Start - Turn 1 ---- 2.0/2.0 ---- 0.076s ---- 0.143s
2: Turn 1 ---- 2.0/2.0 ---- 0.006s ---- 0.009s
3: Straight 1-2 ---- 1.0/1.0 ---- 0.001s ---- 0.003s
4: Turn 2 ---- 2/0/2.0 ---- 0.050s ---- 0.165s
5: Straight 2-3 ---- 1.0/1.0 - 1.5 1.5 ---- 0.004s ---- 0.017s
6: Turn 3 ---- 1.5/1.5 ---- 0.026s ---- 0.068s
7: Turn 4 ---- 1.5/1.5 ---- 0.015s ---- 0.042s
8: Straight 4-5 ---- 1.5/1.5 ---- 0.041s ---- 0.076s
9: Turn 5 ---- 2.0/2.0 ---- 0.027s ---- 0.209s
10: Straight 5 - Finish ---- 2.0/2.0 ---- 0.029 s ---- 0.096s
Banked corners (and sectors effected by banking): Start-turn 1, Turn 1, Turn 2, Straight 2-3, Straight 4-5, Turn 5 and Straight 5-Finish.
Flat corners (and sectors un-effected by banking): Turn 3 and Turn 4
So what do we learn from that data?
From the data of @LeoStrop's Eclectic Lap-time, we can clearly see that camber set at 2.0/2.0 was the big winner in all of the banked turns 1, 2 & 5 as well as the main straight and approach to turn 1 (as these are heavily influenced by the exit of the banked Turn 5 and the banked approach to Turn 1.
But as expected on the two flat corners Turns 3 & 4, a lower camber setting was quicker. With both of these achieved with 1.5/1.5. You can also see that this setting was faster in sector 8 (Straight 4-5) This is due to this not really being a straight. After the tunnel there is a right hand bend towards Turn 5 (Yes, I know you all know this, but you never know who reads these.), this bend has a camber change at the apex as the banking starts and you do record a reasonable amount of Lateral G's here too. Also was quicker in Straight 2-3 (Tied with 1.0/1.0).
For the remaining two sectors Straight 1-2 and Straight 2-3 the 1.0/1.0 setting was recording the best sector times although not by much ( Tied with 1.5/1.5 in Straight 2-3) Again these sectors are also effected a little by the tracks banking.
The really obvious thing from the table is that at no point was 0.0/0.0 the fastest camber setting. Although being fair it was real close to getting it's name on the board, only missing out by a mere thousandth in sector 3 (Straight 1-2).
Sorry guys. I was just going to post my answer to Hami's suggestions and get the track sector info but I couldn't help doing a little analysis of my own. Hope you don't mind
 . And sorry too for not using any crayons (That one's mostly for @Lionheart2113, I know how much you like them
 ), I am having issues with my laptop's office programme
 and haven't got round to fixing it yet.
Hope I didn't miss anything! (I didn't do any difference % calculations as I thought that would just be too much. (And I wanted to leave some of the maths just in case someone got upset...Yes, I mean you @TurnLeft
 )
)Have a good day everyone, I've really got to go to sleep now, that's hour 23 just ticked by.

Edit: I need to get that office programme fixed...Why does this thing not allow multiple spaces


Last edited:


 Maybe that's why I'm always so far behind the really good GT6 racers...
  In all seriousness, I really want this experiment to be valid, but I'll confess I am not 100% confident in some of my suggestions. At the same time, I don't want this to be a nightmare for all of those involved. I am confident that things will work out, in the end, once all the particulars are settled.


