Height Maps from the APK

  • Thread starter Outspacer
  • 217 comments
  • 34,471 views
2,677
United Kingdom
UK
Outspacer
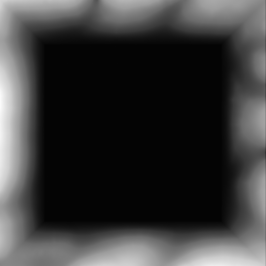
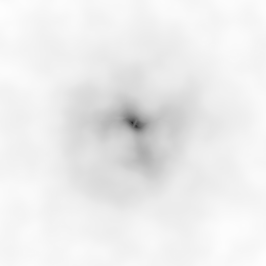
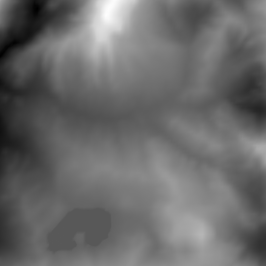
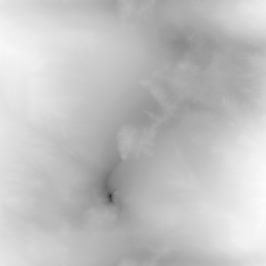
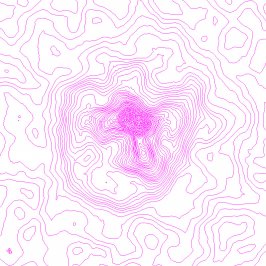
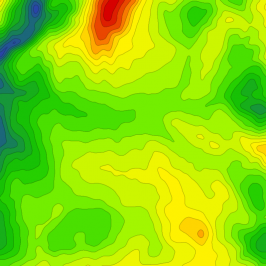
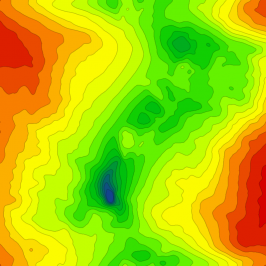
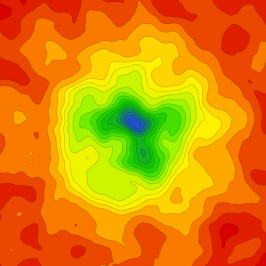
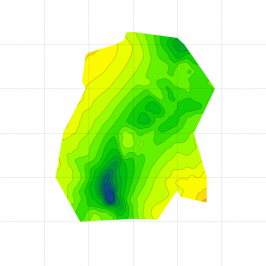
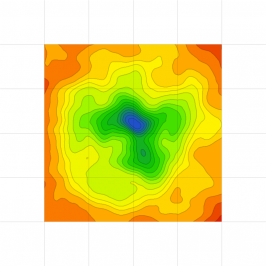
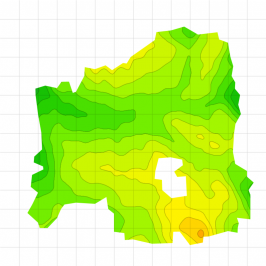
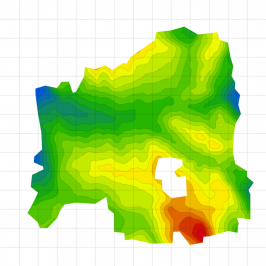
The four largest files in the APK are Unity height maps. I've made images from them where height = red * 256 + green. Quite hard to identify which is which (apart from the flat one, haha), because they don't seem to correlate well with the background image used in the editor. So I'm not sure if they're even correct (if they aren't actually used in the editor, they could be out-of-date), but maybe they'll be useful.

Eifel Flat (file 9bacceb1a11cc4e4fbd104bc1de3c395)
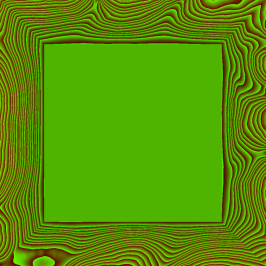
height_c395_rgb.png

Eifel? (file a8b1e792f40ab864694fd23c411c3b06)
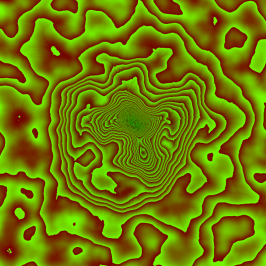
height_3b06_rgb.png

Andalusia? (file 3c9fc867f1d804640a4eebcaf566a957)
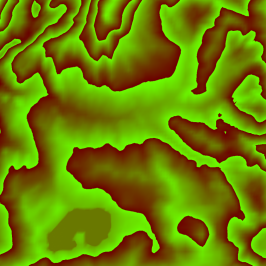
height_a957_rgb.png

Death Valley? (file 359aeb739b399bc488767817f4894b87)
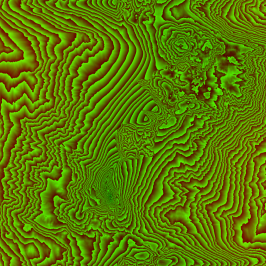
height_4b87_rgb.png
 
Last edited:
BTW, the next four largest (with a UID as a filename, first is "d71517d7c4fbe714999594a8f346963e") are polygon models ("Scenery"). They're so big that there must be more in there than only the red/green/blue splodges. What we see as a backdrop while editing could be just these, or a combination of these and the height maps.
 
Eifel & Andalusia are round the wrong way, that's the big mountain in the middle of Andalusia's map.

I think :)

EDIT: Nope, I'm wrong :)
 
Hmmmm, is there elevation on sides of "Eifel flat" sides... Never tested sides, really useful if so.

Yeah... in the grey bit where you can't draw track! Just there to give a backdrop I guess.

So, darker means a higher elevation?

Darker would naturally be lower. Most of them appear to be roughly bowl-shaped, higher at the edges (again, to give a backdrop). But then (the one I think is) Eifel has what looks like a massively deep well in the centre... errrrr...

I doubt there's anything stopping PD applying a negative scaling value though. Wish I could find some scaling value stored with them, but I can't spot one if it's there. Trying to correlate it with the Scenery polygons might help.

Eifel & Andalusia are round the wrong way, that's the big mountain in the middle of Andalusia's map.

I think :)

EDIT: Nope, I'm wrong :)

Heh :D There's enough clues to make me think I've got them right, but I could well be wrong :)


edit: Dunno if these images help to give an overview. There's less detail visible. I've scaled the heights to go from black to white for each file. But it's clearer for the overall shape.

Eifel Flat (file 9bacceb1a11cc4e4fbd104bc1de3c395)
height_c395.png

Eifel? (file a8b1e792f40ab864694fd23c411c3b06)
height_3b06.png

Andalusia? (file 3c9fc867f1d804640a4eebcaf566a957)
height_a957.png

Death Valley? (file 359aeb739b399bc488767817f4894b87)
height_4b87.png
 
Last edited:
never notice the big hole/mountain inthe center...:odd:

Set up a point to point circuit on one of the outer starting straights [at Eifel] and head a straight line towards the outside of the map, then a 180 bend and straight line towards the middle. Test it out, then adjust your line towards the middle if you see the hill still going downwards on one side of your track.

The greatest elevation change I managed by doing this was just shy of 1400ft.
 
Those maps are really nice, @eran0004 :)

Here are the ranges of values found in the raw heightmaps (over the entire area, not just the allowed):
Code:
Eifel Flat:   15345 - 10041 =  5304
Eifel:        15359 -  1518 = 13841
Death Valley: 15353 -   263 = 15090
Andalusia:    14583 - 13208 =  1375

Andalusia has a much smaller range than the others, so if I hadn't scaled them to use the full greyscale range it would be nearly all orange/red! It's interesting to note that they all have roughly the same max value.

... at Eifel ... The greatest elevation change I managed by doing this was just shy of 1400ft.

If you got close to the full range, that would hint at a unit of 1/10 of a foot for the heightmap values. Which is an odd unit! If you got a bit over 75% of the range, the unit could be 4cm. A bit under, and it could be 5cm - that sounds kinda reasonable. Or thinking in binary, it could be 1/8 of a foot, or maybe 1/16 of a metre. Hmm.
 
Now we just need to overlay the starting lines on these maps to really make it a complete reference tool :D

I would do it but I'm sure someone else will by the time I am able to.

Which if they don't I will this afternoon :cheers:
 
test track1.jpg i'm trying to put a path on eifel since one pair of hours, using eran's coulour map, added to my level lines with photoshop, and a sketch of different starting points and grid on autocad to draw a "possible" road...
as my grand'ma could say... it's most "not easy"than "complicated". after 10 transfers to glue the track with the hills...the track is better, but not closest to the first as it should be. you can try it on my shared tracks, heres, my first autocad sketch
 
Here are the ranges of values found in the raw heightmaps (over the entire area, not just the allowed):
Code:
Eifel Flat:   15345 - 10041 =  5304
Eifel:        15359 -  1518 = 13841
Death Valley: 15353 -   263 = 15090
Andalusia:    14583 - 13208 =  1375

Andalusia has a much smaller range than the others, so if I hadn't scaled them to use the full greyscale range it would be nearly all orange/red! It's interesting to note that they all have roughly the same max value.

What kind of file exactly are those raw heightmaps? As I understand it you converted them in some way to make the grayscale images, right?
 
I wonder if it would be possible to replace the height maps with our own height maps? Or are the land scapes a set geometry?
 
What kind of file exactly are those raw heightmaps? As I understand it you converted them in some way to make the grayscale images, right?

They are Unity "Heightmap Mobile". Basically in this case a raw 1024x1024 grid of 16-bit values wrapped with a small header and footer. It would be possible to reconstruct that raw data from the first images I posted, using "height = red * 256 + green" for each pixel. For the greyscale images, I found the min and max values for each file, and set the pixels to (height - min) * 255 / (max - min) so they used the maximum range.
 
They are Unity "Heightmap Mobile". Basically in this case a raw 1024x1024 grid of 16-bit values wrapped with a small header and footer. It would be possible to reconstruct that raw data from the first images I posted, using "height = red * 256 + green" for each pixel. For the greyscale images, I found the min and max values for each file, and set the pixels to (height - min) * 255 / (max - min) so they used the maximum range.

I found them in the apk now :) Since they're .raw files then can be opened with Photoshop straight away (IBM PC raw format, 1024x1026 px, 16 bit).

Here is an improved Andalusia map, with better contour lines (labeled every 5 steps), smooth topography colour (green = low, yellow/orange/red = high), 1000 m and 200 m grid, and all the home straight locations placed.

andalusia_topography.png


I have attached it as a PDF as well, for better resolution.

That hill in the south looks great for a hillclimb :D
Edit: Hillclimb created!
 

Attachments

  • andalusia_topography.pdf
    746 KB · Views: 94
Last edited:
I found them in the apk now :) Since they're .raw files then can be opened with Photoshop straight away (IBM PC raw format, 1024x1026 px, 16 bit).

Oops, I forgot to say the size of the header (4160 bytes = 4096 of archive header and 64 of heightmap header) and footer (4 bytes) but you appear to have got it lined up fine :)

Here is an improved Andalusia map, with better contour lines (labeled every 5 steps), smooth topography colour (green = low, yellow/orange/red = high), 1000 m and 200 m grid, and all the home straight locations placed.

Beautiful! :bowdown:
 
Oops, I forgot to say the size of the header (4160 bytes = 4096 of archive header and 64 of heightmap header) and footer (4 bytes) but you appear to have got it lined up fine :)

Yeah, after a bit of trial and error :) I lost two pixels on the sides though, probably because I had the wrong header size.
 
I found them ... Here is an improved Andalusia map, with better contour lines (labeled every 5 steps), ...

I have attached it as a PDF as well, for better resolution.

That hill in the south looks great for a hillclimb :D

thank you, thank you, thank you
i-v4NX99n-L.gif
 
@Outspacer Any idea what is causing those "black holes" at the lowest points of Eifel and Death Valley? If it's a linear scale, the darkest spots should be holes in the ground, several hundred meters deep. :confused:

Could it be a logarithmic scale perhaps?

Edit: Looking at this...

Those maps are really nice, @eran0004 :)

Here are the ranges of values found in the raw heightmaps (over the entire area, not just the allowed):
Code:
Eifel Flat:   15345 - 10041 =  5304
Eifel:        15359 -  1518 = 13841
Death Valley: 15353 -   263 = 15090
Andalusia:    14583 - 13208 =  1375

Andalusia has a much smaller range than the others, so if I hadn't scaled them to use the full greyscale range it would be nearly all orange/red! It's interesting to note that they all have roughly the same max value.

... makes me think that Andalusia uses a linear scale and all the other sceneries a logarithmic scale.
 
Last edited:
@Outspacer Any idea what is causing those "black holes" at the lowest points of Eifel and Death Valley? If it's a linear scale, the darkest spots should be holes in the ground, several hundred meters deep. :confused:

Could it be a logarithmic scale perhaps?

I really don't know what they are. Log might be possible, but I can't see why they would do that. Still don't know what they use these heightmaps for anyway! They might clamp them to a lower limit, which could explain why quite large areas of the backdrop images look flat compared to these maps. The scenery files might offer some clues, since the polygons have a 'z' component (they look like XML text, so should be easy to extract and check for value ranges etc).
 
I really don't know what they are. Log might be possible, but I can't see why they would do that. Still don't know what they use these heightmaps for anyway! They might clamp them to a lower limit, which could explain why quite large areas of the backdrop images look flat compared to these maps. The scenery files might offer some clues, since the polygons have a 'z' component (they look like XML text, so should be easy to extract and check for value ranges etc).

I can't see why either, my best guess is that it is a mistake that occurred when reducing the contrast of the raw files. And if the height maps aren't used in the app (they could be the remains after a feature that never made it to the final version) it's maybe a mistake that was never spotted by the developers.

Reducing contrast with the Curves tool in Photoshop:

1. Linear curve (This is similar to what the Andalucia raw file looks like when you open it in Photoshop)

lin.png


2. "Logarithmic" curve (This is similar to what the Death Valley and Eifel raw files looks like when you open them in Photoshop)

log.png


Anyway, regardless of how it happened, I'm afraid it's going to be very difficult to make an accurate topographic map of Eifel and Death Valley.
 
Those maps are really nice, @eran0004 :)

Here are the ranges of values found in the raw heightmaps (over the entire area, not just the allowed):
Code:
Eifel Flat:   15345 - 10041 =  5304
Eifel:        15359 -  1518 = 13841
Death Valley: 15353 -   263 = 15090
Andalusia:    14583 - 13208 =  1375

Andalusia has a much smaller range than the others, so if I hadn't scaled them to use the full greyscale range it would be nearly all orange/red! It's interesting to note that they all have roughly the same max value.


If you got close to the full range, that would hint at a unit of 1/10 of a foot for the heightmap values. Which is an odd unit! If you got a bit over 75% of the range, the unit could be 4cm. A bit under, and it could be 5cm - that sounds kinda reasonable. Or thinking in binary, it could be 1/8 of a foot, or maybe 1/16 of a metre. Hmm.

What if numbers are just starting from "scenery" mountains as high point and deepest point is usable for track, if cutting some margins out from map and using values only from left area it would give proper elevation change range.
 
I can't see why either, my best guess is that it is a mistake that occurred when reducing the contrast of the raw files. And if the height maps aren't used in the app (they could be the remains after a feature that never made it to the final version) it's maybe a mistake that was never spotted by the developers.

Reducing contrast with the Curves tool in Photoshop:

1. Linear curve (This is similar to what the Andalucia raw file looks like when you open it in Photoshop)

View attachment 465406


2. "Logarithmic" curve (This is similar to what the Death Valley and Eifel raw files looks like when you open them in Photoshop)

View attachment 465407

Anyway, regardless of how it happened, I'm afraid it's going to be very difficult to make an accurate topographic map of Eifel and Death Valley.

The Scenery files aren't much help either, there's far less data in them than it looked :(

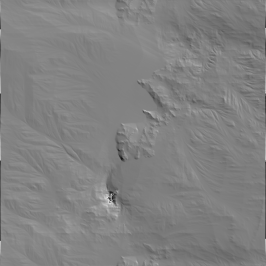
Here's my ham-fisted attempt at turning the heightmap for Death Valley into a lit surface, like the editor backdrop. Well, it matches up over a lot of the area, but then really doesn't in some places :confused: (and there are glitches in the 'well' due to my crappy code).

normal_4b87-5.png

Unless we spot an alternative in the .apk, I'm thinking that the backdrop must be generated from the heightmap combined with some other info... but if it's just to clamp the min value, that could be buried in their code rather than being in a data file.
 
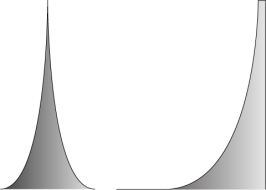
@Outspacer I don't think it's just clamping the min value, there has to be something more to it. Because when looking at the levels of the Andalusia raw vs the Eifel raw you get two very different curves:

spektrum.png

(Left: Andalusia; Right: Eifel)
Like Eifel has been compressed towards the white end of the spectrum and expanded towards the black end. So I'm thinking that it's the entire spectrum that is different, and not just the min values.

But if the height maps are used to create the backdrop, it's possible that this compression/expansion has been deliberately done in order to create more wrinkles in the backdrop, and then to prevent the very darkest areas from going berserk they either clamped it or simply placed another geometry as the base, so when it goes berserk the deepest areas clip through the base and doesn't show.

Anyway, the spectrum can be sort of corrected in Photoshop by using the Levels tool, by placing the neutral tone as close to the white end as possible (0.10 in my version of Photoshop), that gives a more neutral spread:

lvl1.png

White placed at the right end of the spectrum (82),
Black at the left end of the spectrum (0),
Neutral as close to white as possible (0,10)

lvl2.png

^ This is the result, a more neutral spread.

It's not exactly bulletproof, it's more like a guess of what the actual geometry in the game looks like. The topography map created by this method looks like this:

eifel_topography.png


There is no longer a deep hole in the center, and there are more contour curves at the higher points. It's impossible to tell how accurate it is though, but at least it gives a more detailed view of the elevation changes.
 
Back