Non-linear throttle

Just out of curiosity. I will try to make the linear potentiometer not linear.
So basicly try to add more movement to the pedal at higher trottle %
Have a theory how this could work, and will try this next week.
Will report if it works or I need to get new pedals :lol:

Read that the g29 potentiometers are logaritmic, not sure about that. Tested with resistor how it would affect the linearity. Maybe small difference, but the total voltage change became so small, that the accuracy was quite poor.
Maybe some potentiometer/resistor combo would help, but just doesnt seem to be worth the testing.

For my setup, there was huge gear gap in pedal/potentiometer gears resulting dead zone in pedal.
Adjusted gap smaller, and it helped a lot with pedal accuracy.

So, conclusion, g29 pedals are poor quality :lol:
 
@sdi_03 - the resistor thing might work on the throttle if done like in figure 2 or 3 of this note. The G29 pedals start at close to supply voltage and go towards 0V as they are pressed more. Since the pot is about 10k I'd guess at 1k to 2k for the extra resistor, probably 1k would be a good place to start.

Of course then your throttle would be wrong for every other game :lol:
 
Last edited:
Seeing a few grumblings about no changes to the throttle mapping in the latest patch reminded me of a few conversations I had during WT Tokyo.

Best answer I got was the nonlinear throttle is because real life race cars are also mapped this way. I countered in that many of those cars have some type of traction control system in place. What we have in GT Sport doesn't work as such to where you're faster disabling them. Nevermind that a universal map doesn't work when you have a myriad of road cars.

At this point, I don't foresee any changes in GT Sport.
 
Best answer I got was the nonlinear throttle is because real life race cars are also mapped this way.
Unless ACC is unrealistic in what it offers, this suggests real life race cars use different throttle mappings depending on the situation:

e.g. that refers to progressive, aggressive, linear, wet throttle maps. So if the argument is that GTS is simulating real life race cars, it should allow us to choose throttle mappings.

(and can they please do the same for brake linearity while they're at it.....)
 
hummm math ?

Af1K.gif


non linear throttle = ( y = kx² ) ?


EMJcSAOWoAA8MYo
 
hummm math ?

Af1K.gif


non linear throttle = ( y = kx² ) ?


EMJcSAOWoAA8MYo

Your graph shows the real problem with the GTS throttle map, its almost impossible to hit throttle position between 50% and 100%, it's almost like a light switch in that range. After 35 years of auto repair I can promise you it is very easy to find throttle positions between 50% and 100% in cars coming out of the showroom, computer scanner data can back that up. I have even fabricated adjustable throttle ratio linkage for race cars so the driver can adjust the car to different track conditions.
 
hummm math ?
non linear throttle = ( y = kx² ) ?

You're using the wrong function - try an exponential function instead, E.G. y = A*(exp(B*x) - 1) with A and B as parameters.

Plotting with A = 0.09 and B = 2.48 yields:
kWiJBcv.png


Edit:
Because of the boundary condition y(1)=1, we can get rid of one free parameter such that y(x) = (exp(C*x)-1)/(exp(C)-1), C != 0.
The greater value of +/- C, the greater the non-linearity. Plotting with C around 2.45 looks pretty much like the GTS response
 
Last edited:
I very much like these latest posts on the semi vexing subject of non linear throttle in GTS. So much more erudite than me just opining that GTS's throttle implementation sucks huge monkey ball isn't it? :lol:.

It's one of life's minor mysteries as to why PD would adopt a universal throttle map for the game that is so very unrealistic, unintuitive, unhelpful and unpleasant.
 
hummm math ?

non linear throttle = ( y = kx² ) ?
I think the reason why the first part seems so weird is because the pedal has a deadzone to avoid pedals activating due to dirty potentiometers. The ramp seems about right, first you feel nothing and then it kicks all the power on the road.
 
After calibrating my throttle (Fanatec CSL pedals with Loadcell), i found that by feeling i give it 50% and the game registers it as 35/40%, after that the throttle exponentialy increases.
Before i was getting way too much throttle while mid corner, now im getting too little throttle. Come on...
 
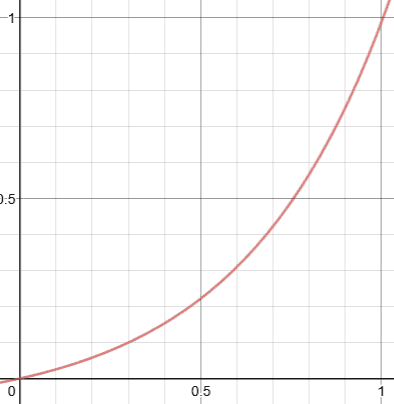
OK, science time. I've always been of the opinion that there's something we don't know about the throttle indicator, and my theory is that it's not showing actual power as many people seem to think, it's showing the percentage of the throttle opening with 0% being fully closed and 100% being fully opened, flat in the airflow. The engine always makes more power than the percentage of the throttle opening as the flowing area of the throttle body cross section grows very rapidly at even minimally small opening angles.

As far as physics goes, doubling the speed (as long as it's limited by lack of power) needs eight times the power as the air resistance increases in the square of speed and there's only half the time to produce the power, thus the necessary power increase is the desired speed increase in the power of three. To put it short: if a 200 bhp car does 200 km/h, making the same car do 400 km/h will take 1600 bhp.


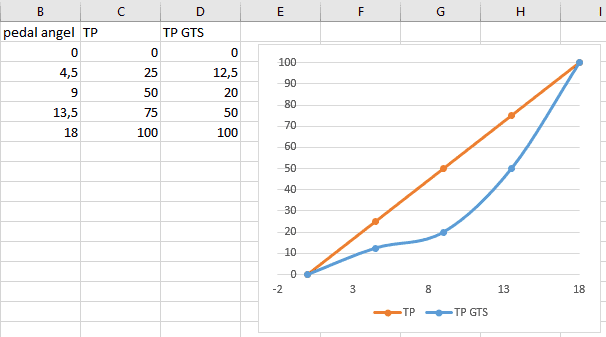
Taking the graphs of @symaski62 and @Skinny McLean as starting points, I took a stock BMW M4 to SSRX. A great car for such a test as the power curve is flat on a wide area, the rpm won't affect the power and all tests were done in the 6th gear which is where the car attains its maximum speed. I tested with the throttle bar at 50%, 75% and 100%.

First, the assumption that the throttle bar shows the actual power the engine is producing.

50% throttle: 278 km/h
75% throttle: 308 km/h
100% throttle: 318 km/h

The speed increase between 50% and 100% throttle is 40 km/h, in other words the increase was 14,4%. To get such an increase in speed the power would have to be increased by nearly exactly 50% but that's not the case, it takes 100% more to get there. Between 50% and 75% throttle the difference is 30 km/h, translating to 10,8% that should be taken care of with a 36% increase but it takes 50% more to get there. And finally the gap from 75% to 100% throttle is a mere 10 km/h, only 3,2% that should need a power hike of 10% to accomplish but in this case it takes 33% more to do it. The verdict: the throttle bar doesn't show actual power, it shows very much less.

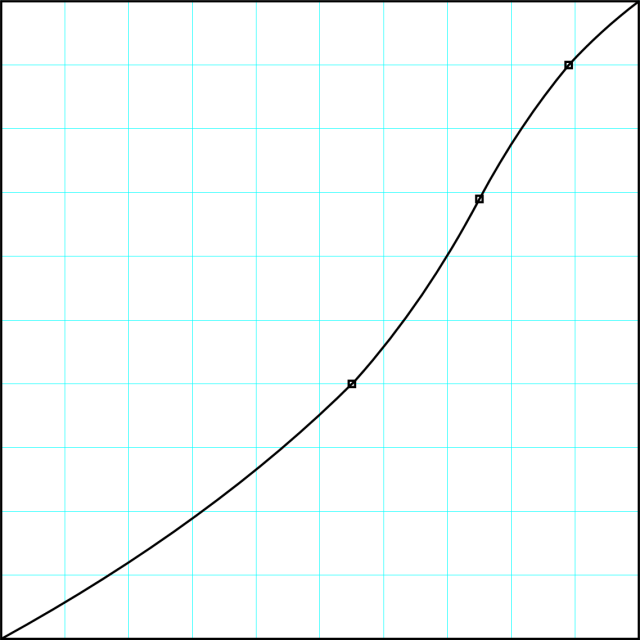
If the 50/75/100 points are actually 75/90/100 (the actual pedal position approximated from the graphs) the results look quite different.

75% pedal travel: 278 km/h
90% pedal travel: 308 km/h
100% pedal travel: 318 km/h

The speed increase between 75% and 90% pedal travel is 40 km/h, in other words the increase was 14,4%. To get such an increase in speed the power would have to be increased by nearly exactly 50% but that's not the case, it only takes 33% more to get there. Between 75% and 90% pedal travel the difference is 30 km/h, translating to 10,8% that should be taken care of with a 36% increase but it only takes 20% more to get there. And finally the gap from 90% to 100% pedal travel is a mere 10 km/h, only 3,2% that should need a power hike of 10% to accomplish and that's just about exactly what happens here. The verdict: the pedal travel doesn't control actual power either but it's closer.

At 50% throttle bar, 75% of pedal travel, the engine is producing roughly 66% of its power. At 75% throttle bar, 90% pedal travel, it's producing roughly 90% power. With those figures all the differences match - a 50% increase between 66 and 100, a 36% increase between 66 and 90, and a 10% increase between 90 and 100.

The final verdict: the throttle is non-linear, but to a much smaller extent than people think, and the throttle bar graphic is completely useless.
 
Nice experiment!

One question: did you account for boost pressure? (Does the game?)

If I've got this right, when the display shows 50%, the M4 is making 67% (power) and the controller / pedal is somewhere around 75% itself.
At 75% on the display, it's 91% power and the controller / pedal is somewhere around the 82-83% mark.

So a pedal movement of ~ 7.5% (of total) returns a gain of 24% of total available power. That is quite a large difference in actuality.

Then it's 25% display, 9 % power and 17.5 % pedal movement to full throttle. All over the place.


EDIT: I calculated power differently to you. I took 318 km/h as 100%, then found the percentage power equivalent as (speed/318)^3. Eg. 100*(308/318)^3 = 90.8...%
 
Last edited:
I think to assume it's modeling a direct link between throttle pedal and butterfly plate would be a bit of a stretch, especially given how few vehicles that's true for, but more just the pure modeling involved.

You'd normally do a simple torque demand on throttle which is how it's done IRL and very easy to simulate too. You can't do throttle vs power demand as power is simply a mathematical derivation from torque and engine speed.
It would be interesting to see some results based on torque - you could probably use acceleration time between two fixed speeds in a fixed gear although im currently sunning myself on holiday and disinclined to think too hard about such things...
The percentages of max available torque and power will be identical.

power = torque x rpm x k

Consider a % of torque, p, we then have

p x power = p x torque x rpm x k

So if a given % of throttle pedal travel maps to a particular % of available torque, it will also map to the same % of available power.

Greycap's test is a good idea, I'll try it myself some time. I'll use a more complete model of the power required for a given speed that includes rolling resistance, in case it has a significant effect on the result.
 
...

So if a given % of throttle pedal travel maps to a particular % of available torque, it will also map to the same % of available power.

...

Only at a given fixed engine speed. The torque and power curves are different shapes, so 90% of peak torque (the figure quoted in specs) occurs at different rpm locations to 90% of peak power.


Is it still possible to significantly limit power output in the game, in order to get a nice flat "curve"? If so, use it on something NA and originally very powerful.

The faster you go, the much less significant rolling resistance becomes, without downforce at least.
 
Is it still possible to significantly limit power output in the game, in order to get a nice flat "curve"? If so, use it on something NA and originally very powerful.

Unfortunately (in this case, otherwise it's a good thing) not. That's why I used the M4 as it was the first car that came to mind with a flat powerband in the rpm range that was needed for testing, the fact that it has a turbo engine may cause issues, or it may not. Far too many variables involved anyway but anything to overcome the current trend of blindly bashing the non-linearity while basing it purely on the graphic is a start. I'l look into conducting another test myself at some point.

EDIT: another quick test done. Ferrari 330 P4, an NA engine with a flat power curve from ~6000 to ~8000 rpm, geared to hit the aero wall at 7500 rpm at full throttle.

50% throttle bar: 280 km/h
75% throttle bar: 313 km/h
100% throttle bar: 323 km/h

In other words, results so similar to the M4 that the differences are within the margin of error of hitting the exact throttle percentage.

I'd also disagree slightly with the 75% throttle bar being at 82-83% of pedal travel. Definitely closer to 90%, there's nearly no travel left before it hits the upper deadzone and registers 100% throttle despite the pedal still moving a few mm further.
 
Last edited:
Unfortunately (in this case, otherwise it's a good thing) not. That's why I used the M4 as it was the first car that came to mind with a flat powerband in the rpm range that was needed for testing, the fact that it has a turbo engine may cause issues, or it may not. Far too many variables involved anyway but anything to overcome the current trend of blindly bashing the non-linearity while basing it purely on the graphic is a start. I'l look into conducting another test myself at some point.

EDIT: another quick test done. Ferrari 330 P4, an NA engine with a flat power curve from ~6000 to ~8000 rpm, geared to hit the aero wall at 7500 rpm at full throttle.

50% throttle bar: 280 km/h
75% throttle bar: 313 km/h
100% throttle bar: 323 km/h

In other words, results so similar to the M4 that the differences are within the margin of error of hitting the exact throttle percentage.

I'd also disagree slightly with the 75% throttle bar being at 82-83% of pedal travel. Definitely closer to 90%, there's nearly no travel left before it hits the upper deadzone and registers 100% throttle despite the pedal still moving a few mm further.


You'd need to incorporate drag into that too, as drag squares with speed so even with a flat power curve, drag is going to negatively affect how that translates into speed
 
At 50% throttle bar, 75% of pedal travel, the engine is producing roughly 66% of its power. At 75% throttle bar, 90% pedal travel, it's producing roughly 90% power. With those figures all the differences match - a 50% increase between 66 and 100, a 36% increase between 66 and 90, and a 10% increase between 90 and 100.
I repeated your experiment, using the same car, testing at 25%, 50%, 75% and 100% of the on-screen bar, and using symaski62's graph to estimate pedal travel %. I used a more detailed model of the required power, incorporating drivetrain losses and crr, and fitted cda and crr to make the theoretical power required for the speed match the stated engine power. It didn't change the figures all that much, the green cells show the figures corresponding to what you stated above, e.g. I got 69% of power at 75% of pedal travel rather than your 66%, not a major difference.

gtsthrottle.jpg


Only at a given fixed engine speed. The torque and power curves are different shapes, so 90% of peak torque (the figure quoted in specs) occurs at different rpm locations to 90% of peak power.
We're talking about peak power and torque at the current rpm, rather than peak power and torque across all rpm, which as you note, will usually occur at different rpm to each other. So if the throttle pedal being partially depressed reduces power to 50% of the max power at that rpm, it is also reducing torque to 50% of the max torque at that rpm.
 
I have been more or less able to reproduce your M4 results as well, but found an anomaly at the same time.

For 25% displayed throttle, I got three four different top speeds for three four different gears. Not a huge surprise, but the numbers certainly look odd:

4th: 117 mph @ 6100 rpm
5th: 126 mph @ 5150 rpm
6th: 127 mph @ 4375 rpm
7th: 132 mph @ 3625 rpm

The boost gauge might seem to suggest why this is the case; the "vacuum" was highest in 4th, lowest in 6th 7th.

EDIT: My full results:

6th gear:
....25%: 127 mph @ 4375 rpm
....50%: 174 mph @ 6075 rpm
....75%: 193 mph @ 6575 rpm
100%: 196 mph @ 6850 rpm

7th gear:
....25%: 132 mph @ 3625 rpm
....50%: 181 mph @ 5000 rpm
....75%: 198 mph @ 5550 rpm
100%: 198 mph @ 5550 rpm
 
Last edited:
One thing I noticed in doing the testing was that it was very hard to hold the throttle bar at a specific %. When moving the pedal, the bar would often be flickering up and down 20%. After holding it perfectly still for a while, it would settle down, but the relationship between position and the bar was a bit unpredictable. A tiny change in pressure on the pedal could move the bar quite a lot, but then pushing a bit more and moving the pedal might cause it to drop again. I guess this is all potentiometer noise, and I'm suspecting it might actually be causing me more problems than the non-linearity.
 
I repeated your experiment, using the same car, testing at 25%, 50%, 75% and 100% of the on-screen bar, and using symaski62's graph to estimate pedal travel %. I used a more detailed model of the required power, incorporating drivetrain losses and crr, and fitted cda and crr to make the theoretical power required for the speed match the stated engine power. It didn't change the figures all that much, the green cells show the figures corresponding to what you stated above, e.g. I got 69% of power at 75% of pedal travel rather than your 66%, not a major difference.

Now we're talking. 👍 This is the kind of discussion I wanted to get going!

Your results are very interesting, and they actually prove that the throttle is a lot more linear in the upper half of its travel than previously thought. This far the common opinion has been along the lines that judging by the throttle bar graphic the last quarter of the pedal travel controls half of the power, now we have the results of three different people clearly showing that this isn't the case. The last quarter actually controls 31% of the power which, while not linear, is very much closer to it. Using your numbers the throttle curve now looks like this, quite distinctly different from the ones made using the throttle bar and pedal travel as base.

EDIT - made a mistake, the last dot is showing 90% power when it should be 91%...

 
It is very important that we get this right, definitely, and thanks to you both for doing this.

That curve is still far less than ideal, though. It is perfectly understandable for people to lean on the graphic, being as we are very visual beasts. But looking at the curve, it is little surprise to me that fine throttle control is as tricky as it is at times.

It's like driving a car that will suddenly come on boost, or an old school pipey two stroke motorcycle.

That portion of the curve between 50% and 75% is not especially friendly. See how flat the curve is around a trailing throttle (<<50%), and then as you roll on at corner exit, the gradient changes significantly. This breaks feedback and feel of what the throttle is doing - so, again, little wonder everyone's looking at the bar display. And in fact, we must all have had some reason to have been paying so much attention to it in the first place.

It also means it's very easy to add too much throttle just when you need to be as precise as possible to get the best drive out of the corner. Just the right kick of torque at the wrong time will break traction entirely and in a non-progressive way. Frustrating.


I experienced the same low resolution / high noise input issues when testing that @breeminator mentioned, albeit with a DS4. When it jumps 5-10% at a time, combined with that curve, it's not hard now to understand the complaints.

As I've said before, this disappoints me, because PD have historically got this whole primary; input / output; control / feedback; person-in-the-loop; thing absolutely nailed.

EDIT: Here's my interpretation of the data thus far:
GT-Sport-Input.png
 
Last edited:
I am surprised you guys can modulate the throttle accurately between 50% and 100% according to the bar on the screen in BBC the game. Maybe it depends on the hardware you use, I have Fanatec V3 load cell pedals and it is very, very difficult to hit anything between 50% and 100%.
 
Back